Dashboard
Access the dashboard at http://<server-ip>:<port>/<dashboard-path>
The Krawl dashboard is a single-page application with five open tabs — Overview, Attacks, Threats, Advanced search and IP Insight — and six more that appear once you authenticate with the dashboard password: Tracked IPs, Banlist, Timed out, Deception, Rules and Webhooks.
Every IP address in a table is a link to its IP Insight page, so it can be
reached with Tab and opened with Enter. The page address carries the IP
(#ip-insight/<ip>): the browser's back button walks between the IPs you
inspected, and a reload or a shared link reopens the same one.
Overview
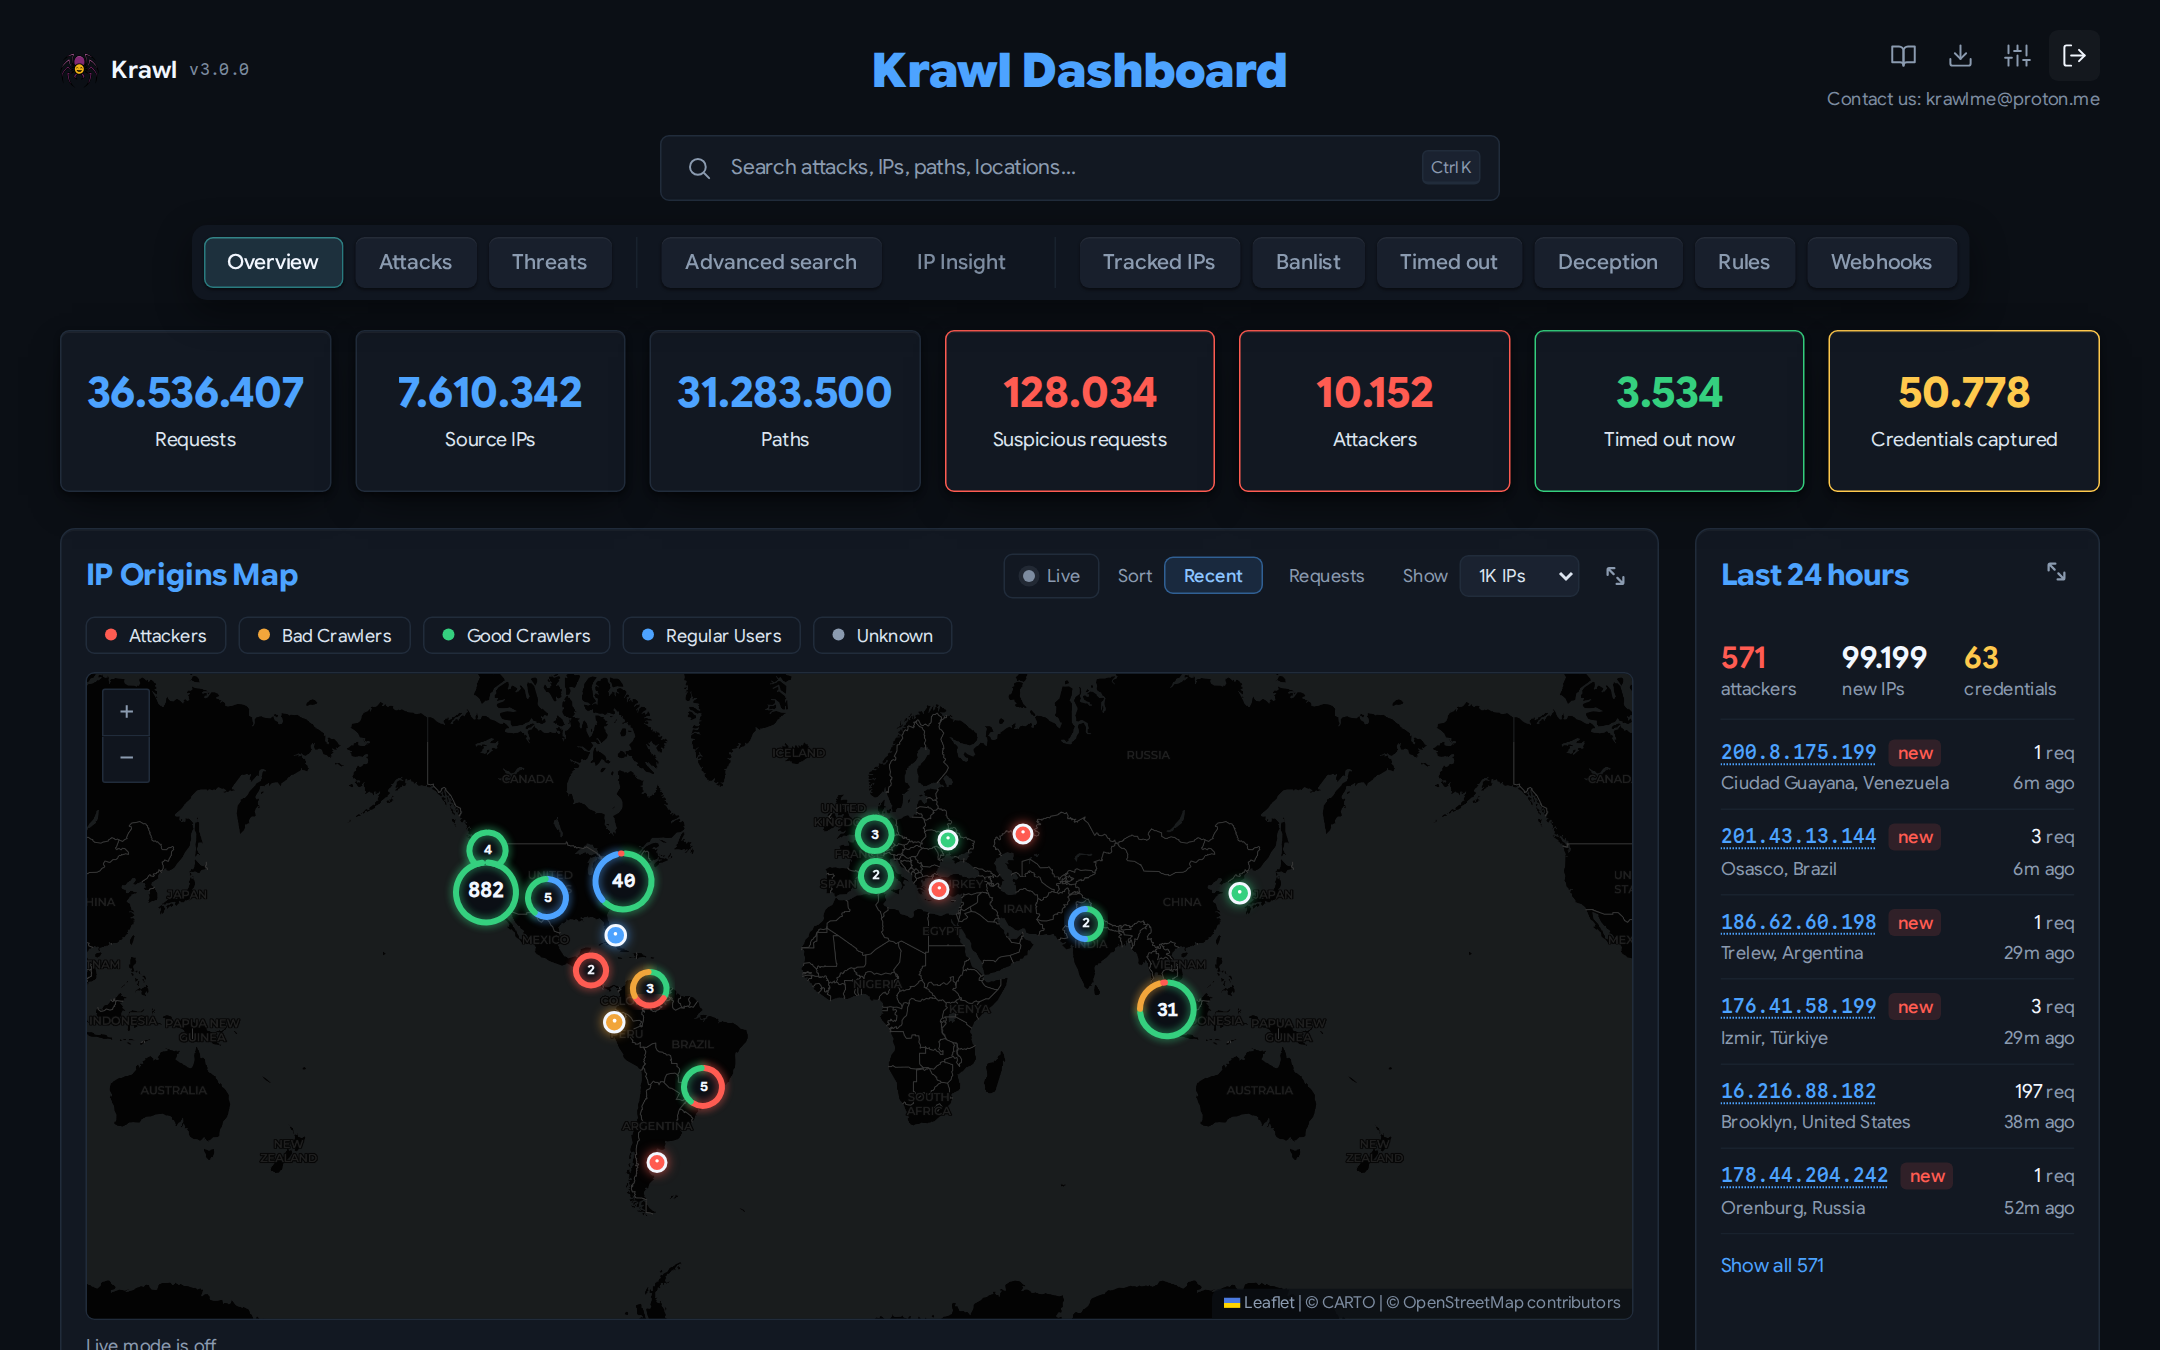
The default landing page answers "what changed?" first, then "how much, in total?".
Last 24 hours
The lead panel counts attackers active, new IPs seen and credentials captured in the last 24 hours, and lists the attackers active in that window, most recent first. Each one opens in IP Insight, where it can be tracked or banned.
Summary tiles
Seven all-time totals sit under it. Only the hostile, trap and defence figures are coloured:
- Requests — total number of requests received
- Source IPs — distinct IP addresses observed
- Paths — distinct request paths
- Suspicious requests — requests flagged as suspicious, with their share of all requests
- Attackers — distinct IPs classified as attackers, with how many were active in the last 24 hours
- Timed out now — IPs currently held on an automatic ban
- Credentials captured — login attempts captured by the honeypot
Search
A real-time search bar lets you search across attacks, IPs, patterns, and locations. Results are loaded dynamically as you type.
IP Origins Map
An interactive world map (powered by Leaflet) displays the geolocation of top IP addresses. You can filter by category:
- Attackers
- Bad Crawlers
- Good Crawlers
- Regular Users
- Unknown
The number of displayed IPs is configurable (top 10, 100, 1,000, or all).
Markers cluster as you zoom out, and each cluster is ringed in the proportions of the categories inside it, so a cluster that is mostly attackers reads red before you click it. The view fits itself to the visible markers rather than opening at a fixed zoom, which keeps the framing right on any screen width and re-fits when you toggle a category off. It will not zoom past a global overview on load — panning in is left to you.
The basemap is deliberately desaturated so that the category colours are the only saturated thing on the panel. See Map tiles to change the tile provider.
Recent Suspicious Activity
A table showing the last 10 suspicious requests with IP address, path, user-agent, and timestamp. Clicking the address opens it in IP Insight; each entry also links to the raw HTTP request.
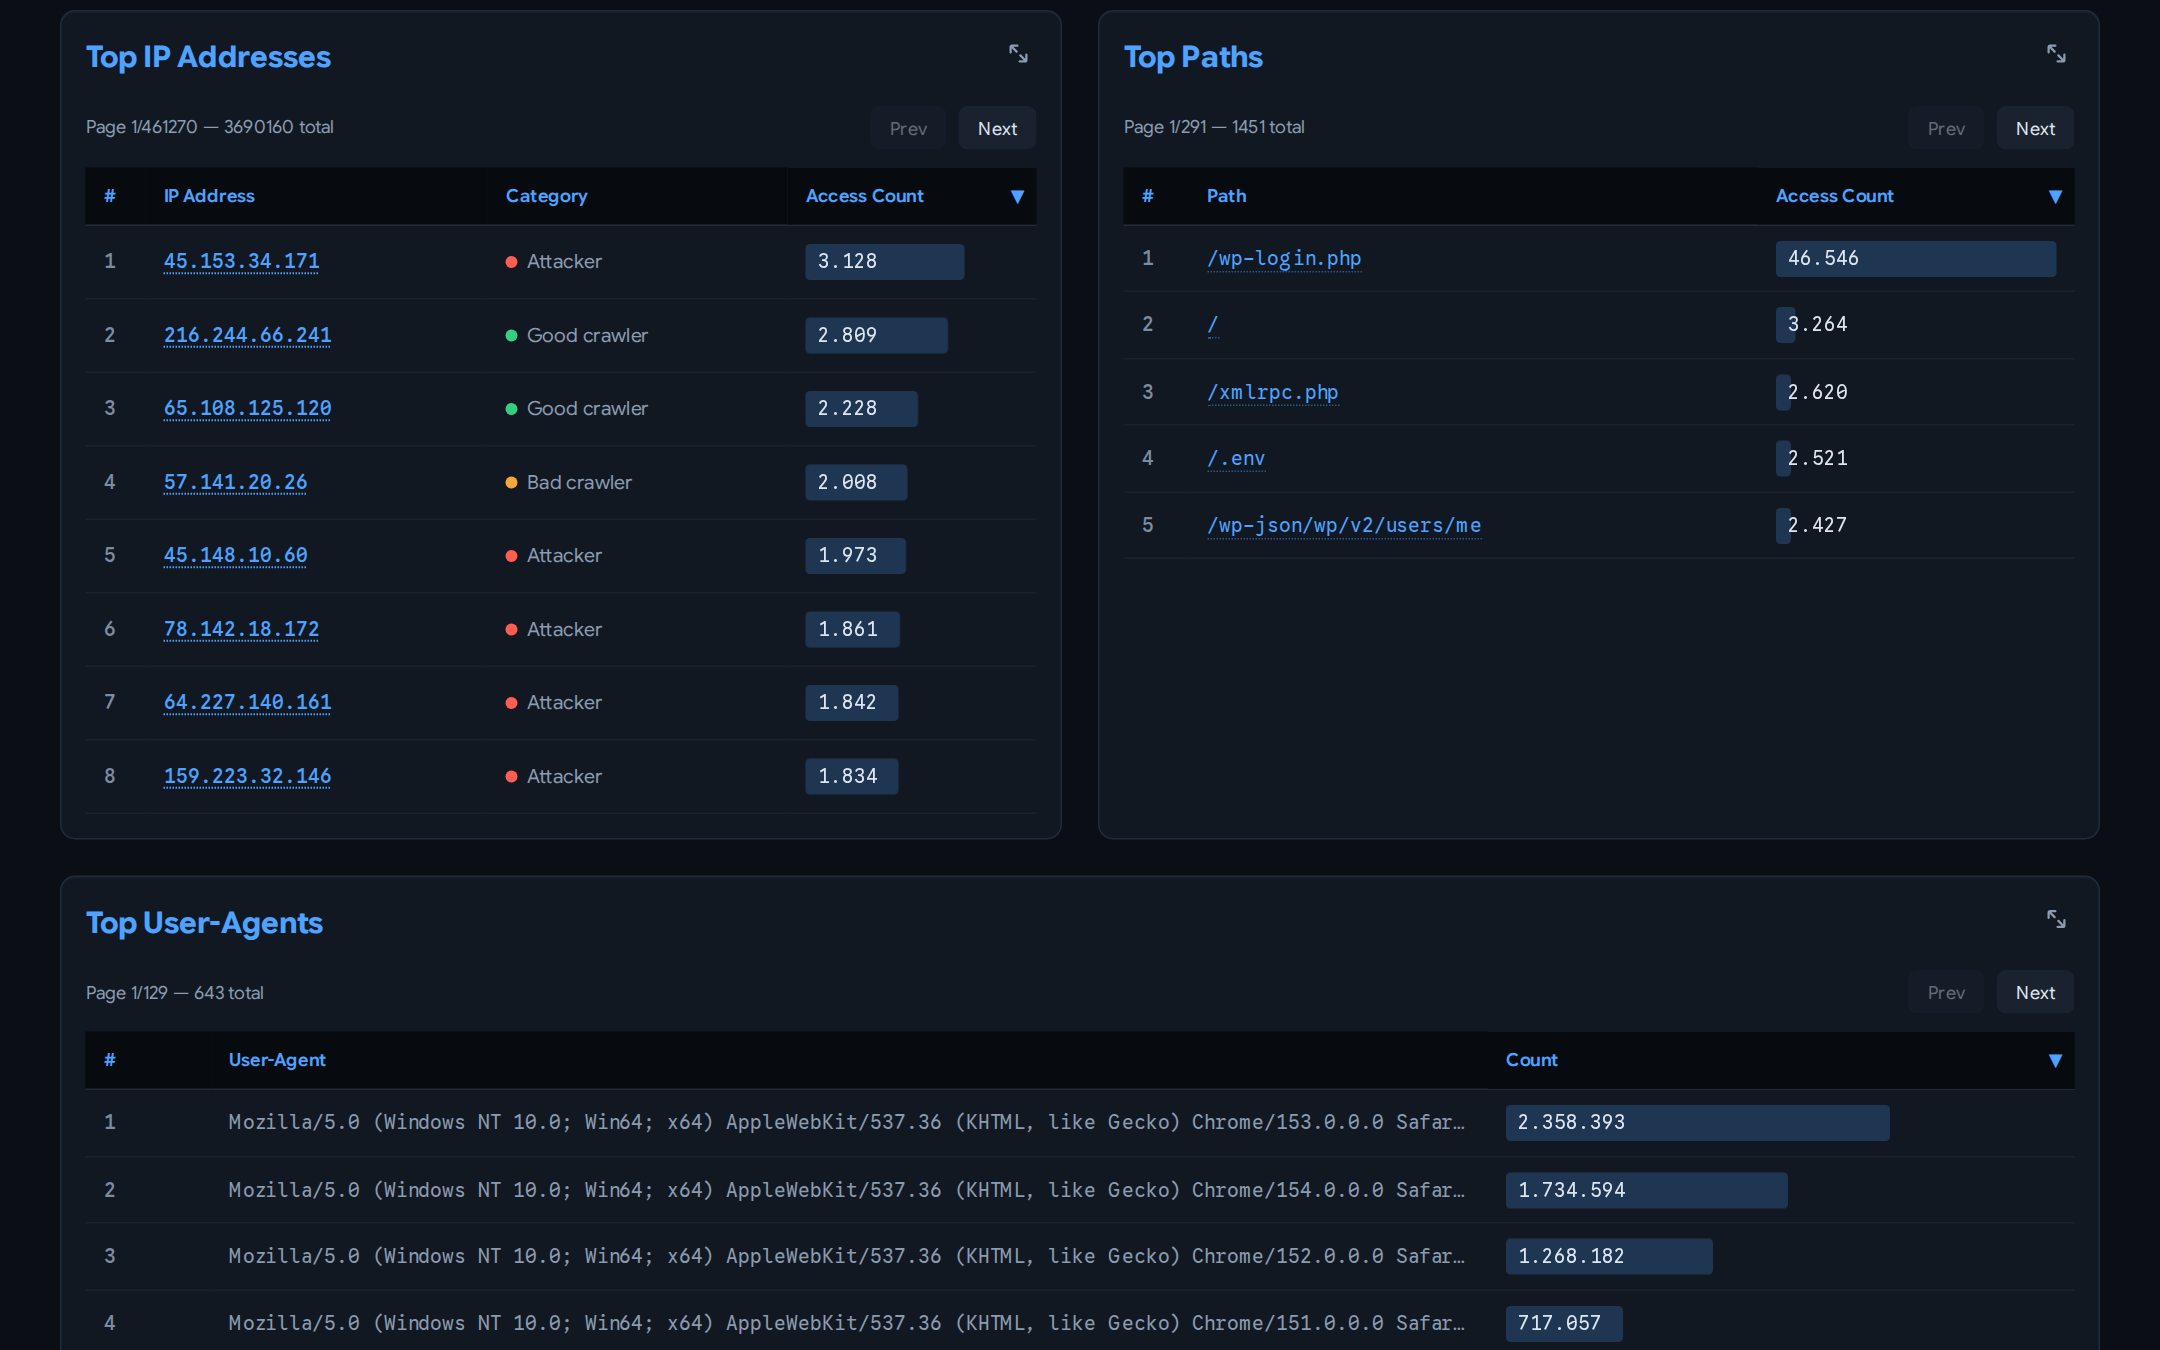
Top IP Addresses
A paginated, sortable table ranking IPs by access count. Each IP shows its category badge, and clicking the address opens it in the IP Insight tab — the same place the magnifier button goes.
Top Paths
A paginated table of the most accessed HTTP paths and their request counts.
Top User-Agents
A paginated table of the most common user-agent strings with their frequency.
Attacks
The Attacks tab focuses on detected malicious activity, attack patterns, and captured credentials.
Attack Trends
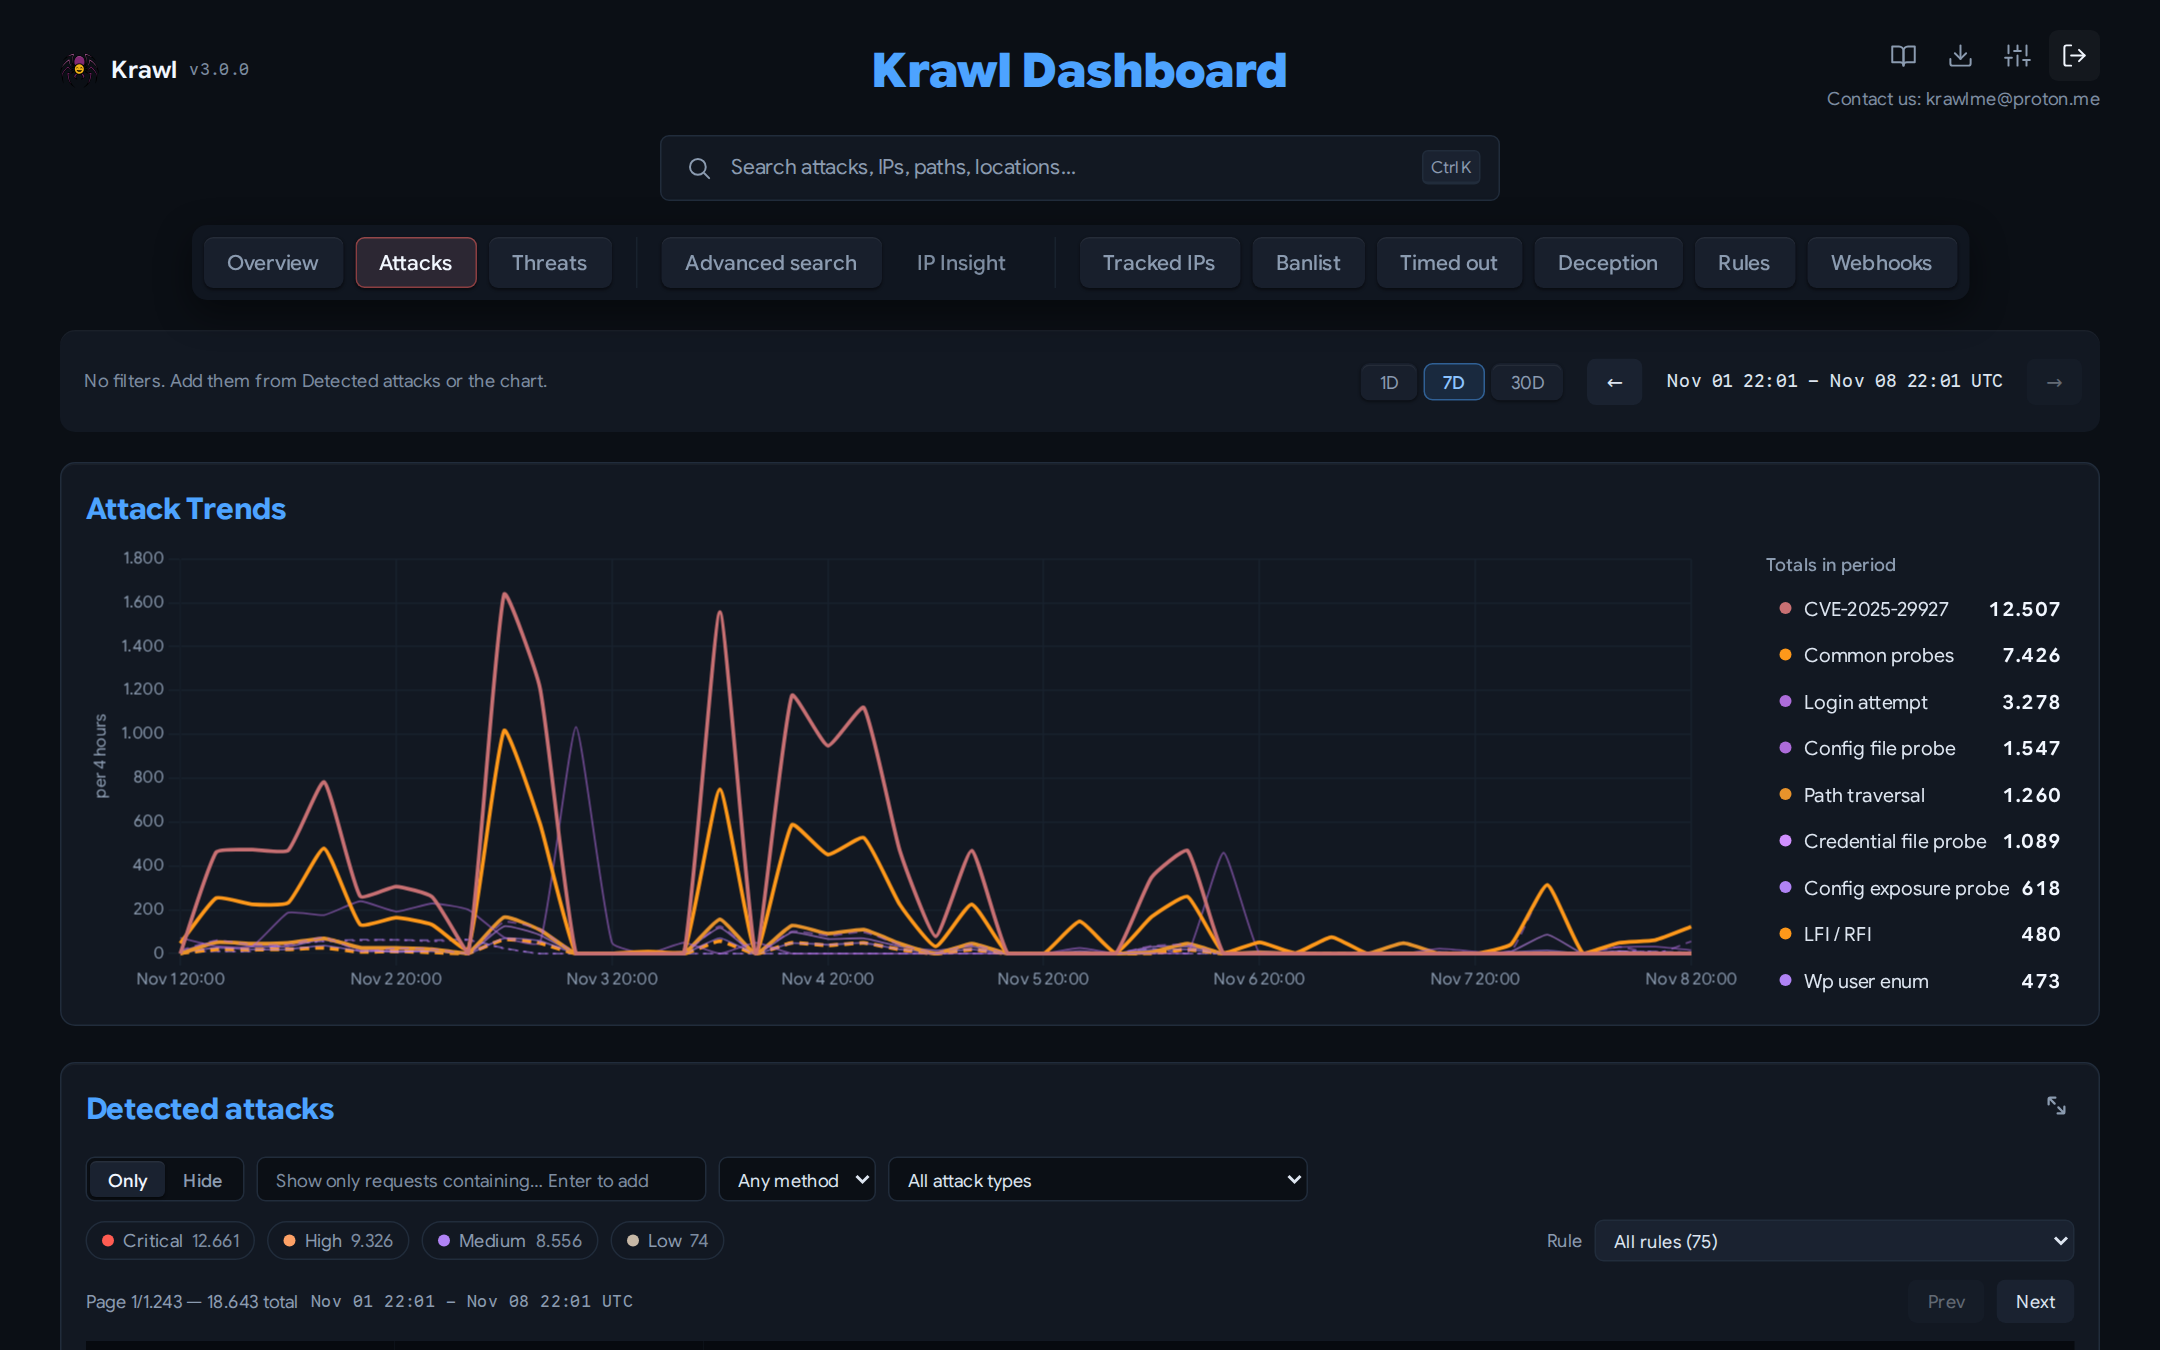
A line chart of detections per attack type over the period, one line per type. The totals above it count detections and attack types in the window.
Period and drill-down
The Attacks tab shares one period across the trends chart, the Detected attacks table, Attackers in period, Captured Credentials, Targeted Domains and Honeypot Triggers.
- Period bar: pick 1D, 7D or 30D, and step to older or newer windows of that length. Labels are in UTC.
- Buckets: the trends chart groups detections into 1 hour (1D), 4 hour (7D) or 1 day (30D) slots.
- Drill down: click a slot in the chart. The table, charts and attackers re-scope to that slot, and the totals show that slot only. Click it again, or its pill, to go back.
- Keyboard: below the chart, a list of the slots (hidden from sight) is a single Tab stop. Left/Right (or Up/Down, Home, End) move between slots, Enter or Space toggles one, and the focused slot shows its tooltip.
- Colours: each attack type is coloured by its worst rule severity (critical red, high orange, medium violet, low sand) and a stable shade within that band. Critical and high lines are thick; medium and low are thinner and fainter. See Design system.
Filters
The period bar at the top shows the applied filters as pills on the left (click a pill's x to remove it, or Clear all) and the 1D / 7D / 30D window on the right. Filters are added in the Detected attacks panel (or its expanded view) and from the chart; they then apply to the whole tab.
- Text filter: pick Only or Hide next to the Detected attacks filter box, type, and press Enter. only "…" keeps just the requests whose IP, path or user agent contains the text; hide "…" drops them. Terms stack (up to 10 of each) and all must hold. Click a pill's only / hide word to flip it. Escape clears the box.
- Method and attack type pickers narrow to one HTTP method or one attack type.
- Severity chips: toggle critical, high, medium and low. Several can be on at once.
- Rule picker: choose one YARA rule. Choosing a severity chip clears a rule that no longer fits.
- Attack type, IP and slot filters come from clicking a type, an IP or a chart slot.
- Scope: the text filter, Not terms, method and IP narrow every panel: the trends chart and its totals, Detected attacks, Attackers in period, Captured Credentials (matched on IP, path and username), Targeted Domains and Honeypot Triggers. Type, rule and severity narrow Detected attacks and Attackers in period only. A panel's range label names any active filter it does not apply, for example "type, severity not applied".
- Saved filters: the filters and the span are kept in the browser (localStorage) and come back when you reload or open the Attacks tab again. A link with filters in its
#attacks?…hash wins over the saved ones; the clicked slot and older periods are not saved.
Attackers in period
A list of the IPs seen in the current period and filters, ranked by detections (matching detected attacks, not raw requests). It follows the period, slot, type, rule and severity. Overlays opened from other tabs (such as Top Attackers) keep showing all-time data.
Linkable view
The state is kept in the URL, so a view can be bookmarked or shared:
#attacks?days=7&offset=0&slot=2026-10-29T08&type=sql_injection&rule=...&sev=high,critical&ip=1.2.3.4
| Field | Meaning |
|---|---|
days |
1, 7 or 30 |
offset |
Days back from now (0 = latest); the arrows step by the span |
slot |
UTC bucket start, YYYY-MM-DDTHH |
type, rule |
Attack type or YARA rule name |
sev |
Comma list of critical, high, medium, low |
ip |
Source IP |
search, method and exclude are also kept. Invalid fields are dropped when the link loads.
Captured Credentials
A table of usernames and passwords captured from honeypot login forms, with timestamps. Useful for analyzing common credential stuffing patterns.
Targeted Domains
Ranks normalized HTTP Host targets by retained request count, including the
number of distinct source IPs and first/last seen times. Ports and trailing root
dots are removed, so Example.org:443 and example.org aggregate together.
The standard Forwarded and X-Forwarded-Host fields are used only when the
request has no Host field.
The table follows the period; the Link map (all time) next to it always covers every retained request.
Honeypot Triggers by IP
Shows which IPs accessed honeypot endpoints and how many times, sorted by trigger count.
Detected attacks
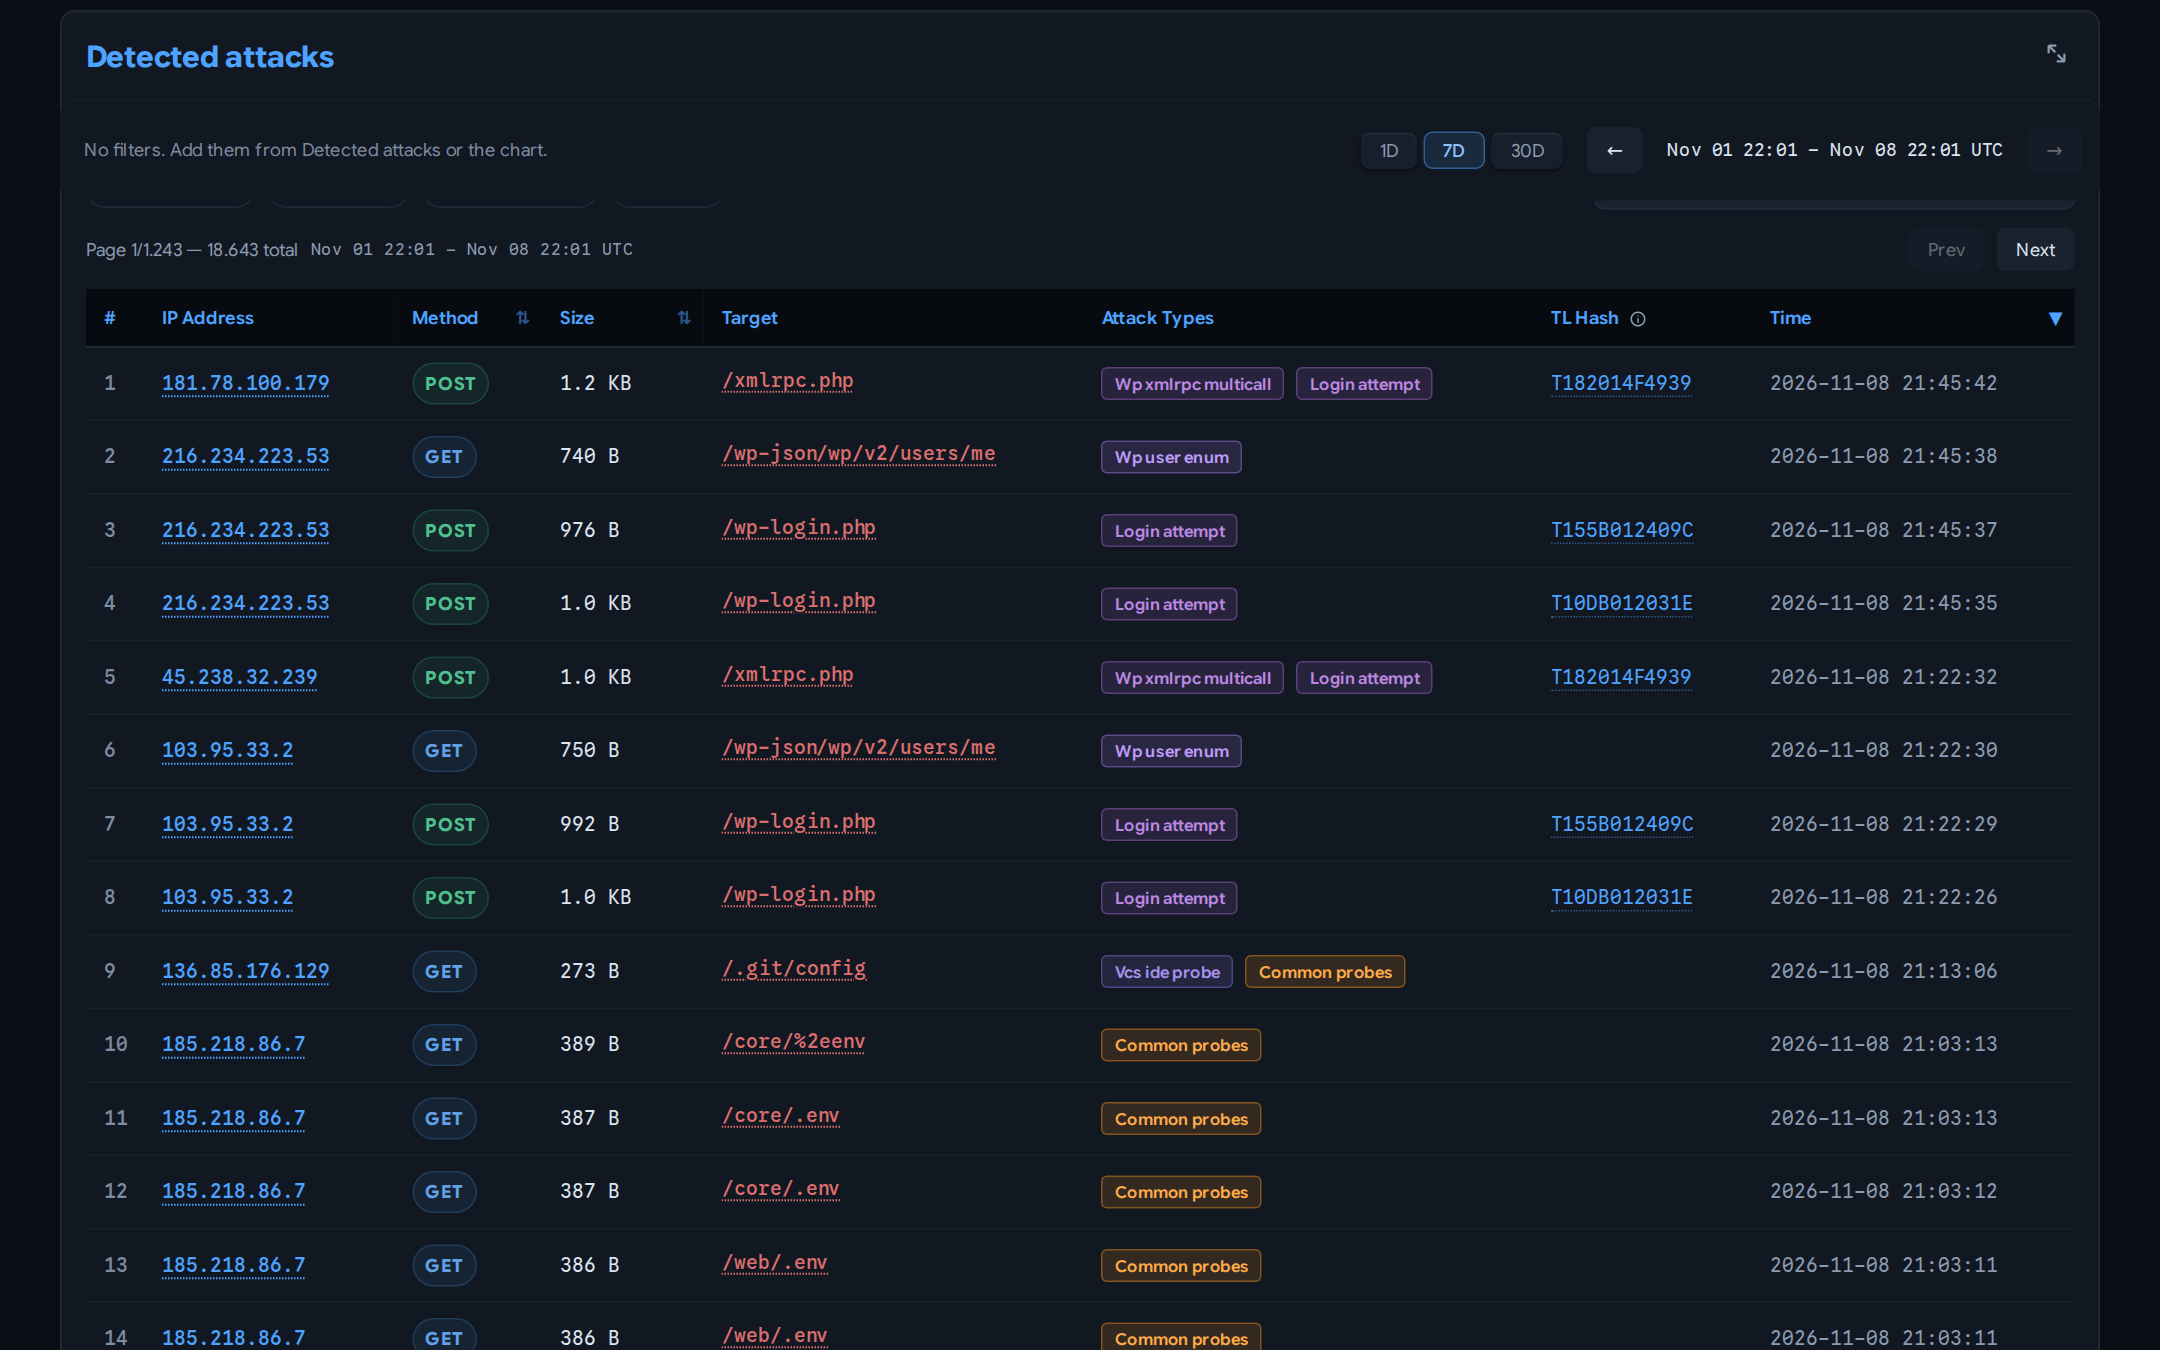
A detailed table of individual attack detections showing IP, path, attack type classifications, user-agent, request method, size, and timestamp. The size column is sortable, so the heaviest payloads surface first. Each entry can be expanded to view the raw HTTP request.
In the expanded view, filter by method, attack type or the Filter box. Turn on Hide next to it to invert the match: each time you press Enter, the typed text is added as a hide "…" pill and every request whose IP, path or user agent contains it (ignoring case) is hidden. Terms add up, so wp-login ⏎ app ⏎ test ⏎ shows requests matching none of the three, up to 10 terms. Click a pill's × to bring those requests back; turn Hide off to go back to a normal live search.
Attachments. When the request carried an upload — a webshell, a malware sample, an exfiltration payload — a paperclip button appears in the raw request modal listing the uploaded files, and downloads the one you click. Both multipart/form-data parts and raw-body uploads are recognised. Treat every download as hostile and open it in a sandbox. Requests with bodies above 64 KB are not buffered, so they have no retrievable attachment. The same data is available through the Dashboard API.
Threats
The Threats tab groups captured payloads into campaigns. Krawl fuzzy-hashes
every captured file and flagged request body with TLSH, then clusters digests
within analyzer.tlsh_cluster_threshold of each other — so a webshell and its
lightly-edited variants land in one campaign rather than looking like unrelated
one-off hits.
Hashing runs as the scheduled hash-payloads task, not at request time: new
captures are hashed on the next run, and existing history is swept backwards
once, tracked by a watermark. A freshly upgraded instance therefore fills this
tab in over a few task cycles rather than immediately.
The whole tab is pre-computed by the warmup task, so it opens instantly; see Cache warmup.
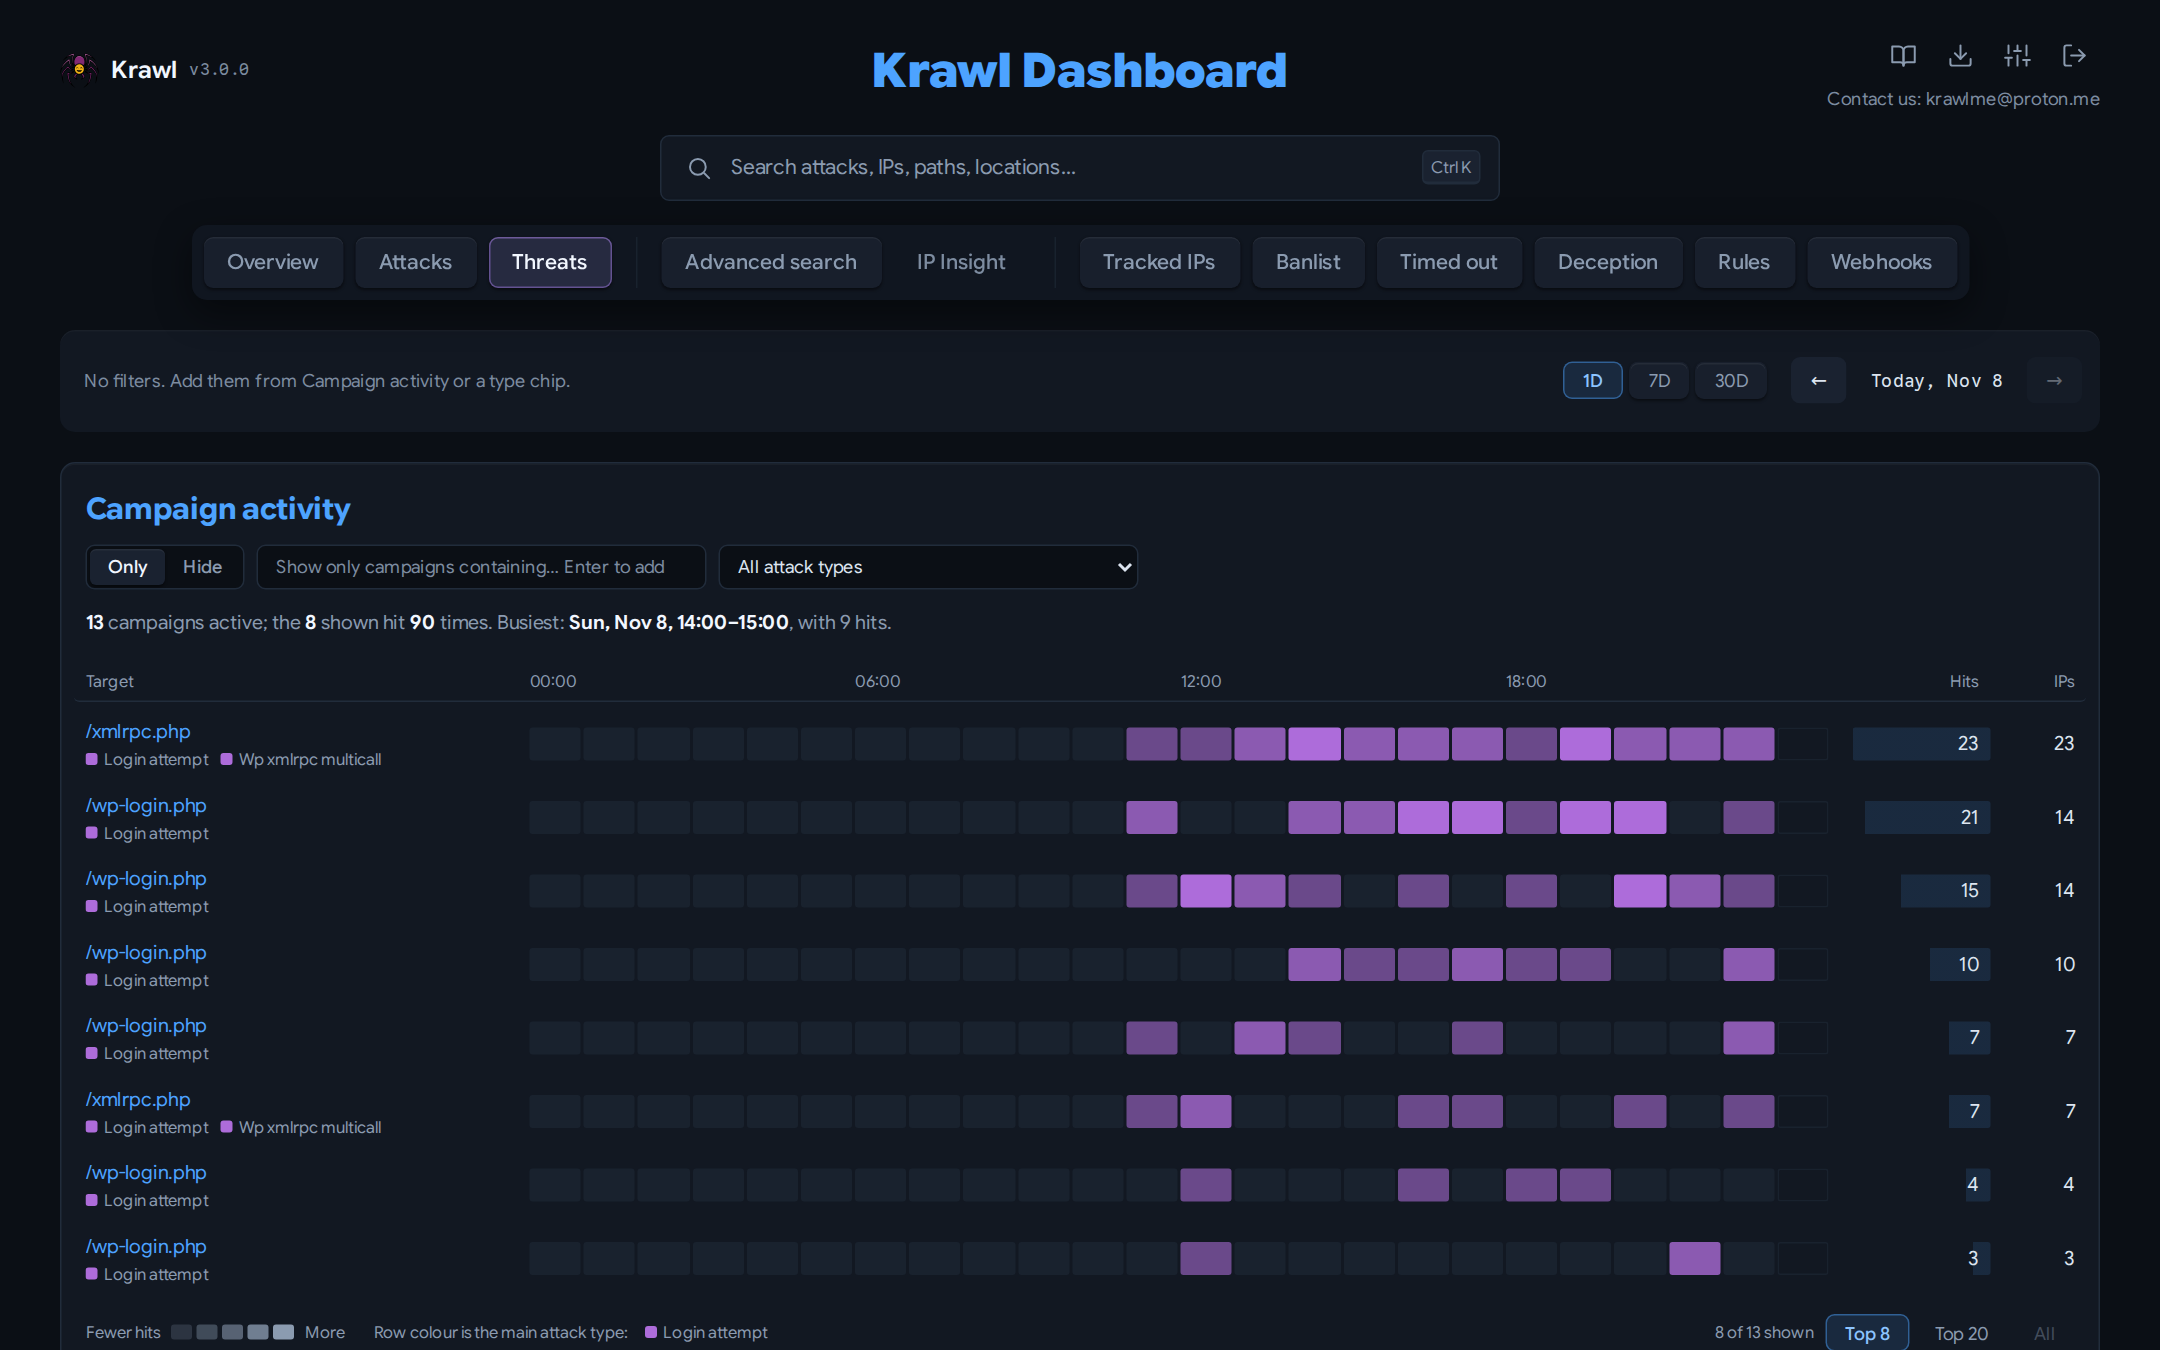
Campaign activity
A heatmap with one row per campaign and one cell per hour (1D) or day (7D, 30D); brighter cells mean more hits. Each row names the target path, its attack types, total hits and distinct IPs. Arrows step through earlier periods. Narrow it with Only / Hide terms, an attack type picker, or the Top 8 / Top 20 / All toggle. Clicking a row or a type chip adds it as a filter for the whole tab.
Campaigns
Each recurring payload pattern, with how many times it was seen and how many
distinct IPs sent it. A campaign appears only once its payload has been seen
more than analyzer.tlsh_campaign_min_events times, which keeps one-off probes
out of the table.
Captured files
An index of every file Krawl captured, across all IPs — name, size, type and the
campaign it belongs to. New uploads are extracted inline; the scheduled
extract-captured-files task scans retained historical raw requests in bounded
batches after an upgrade.
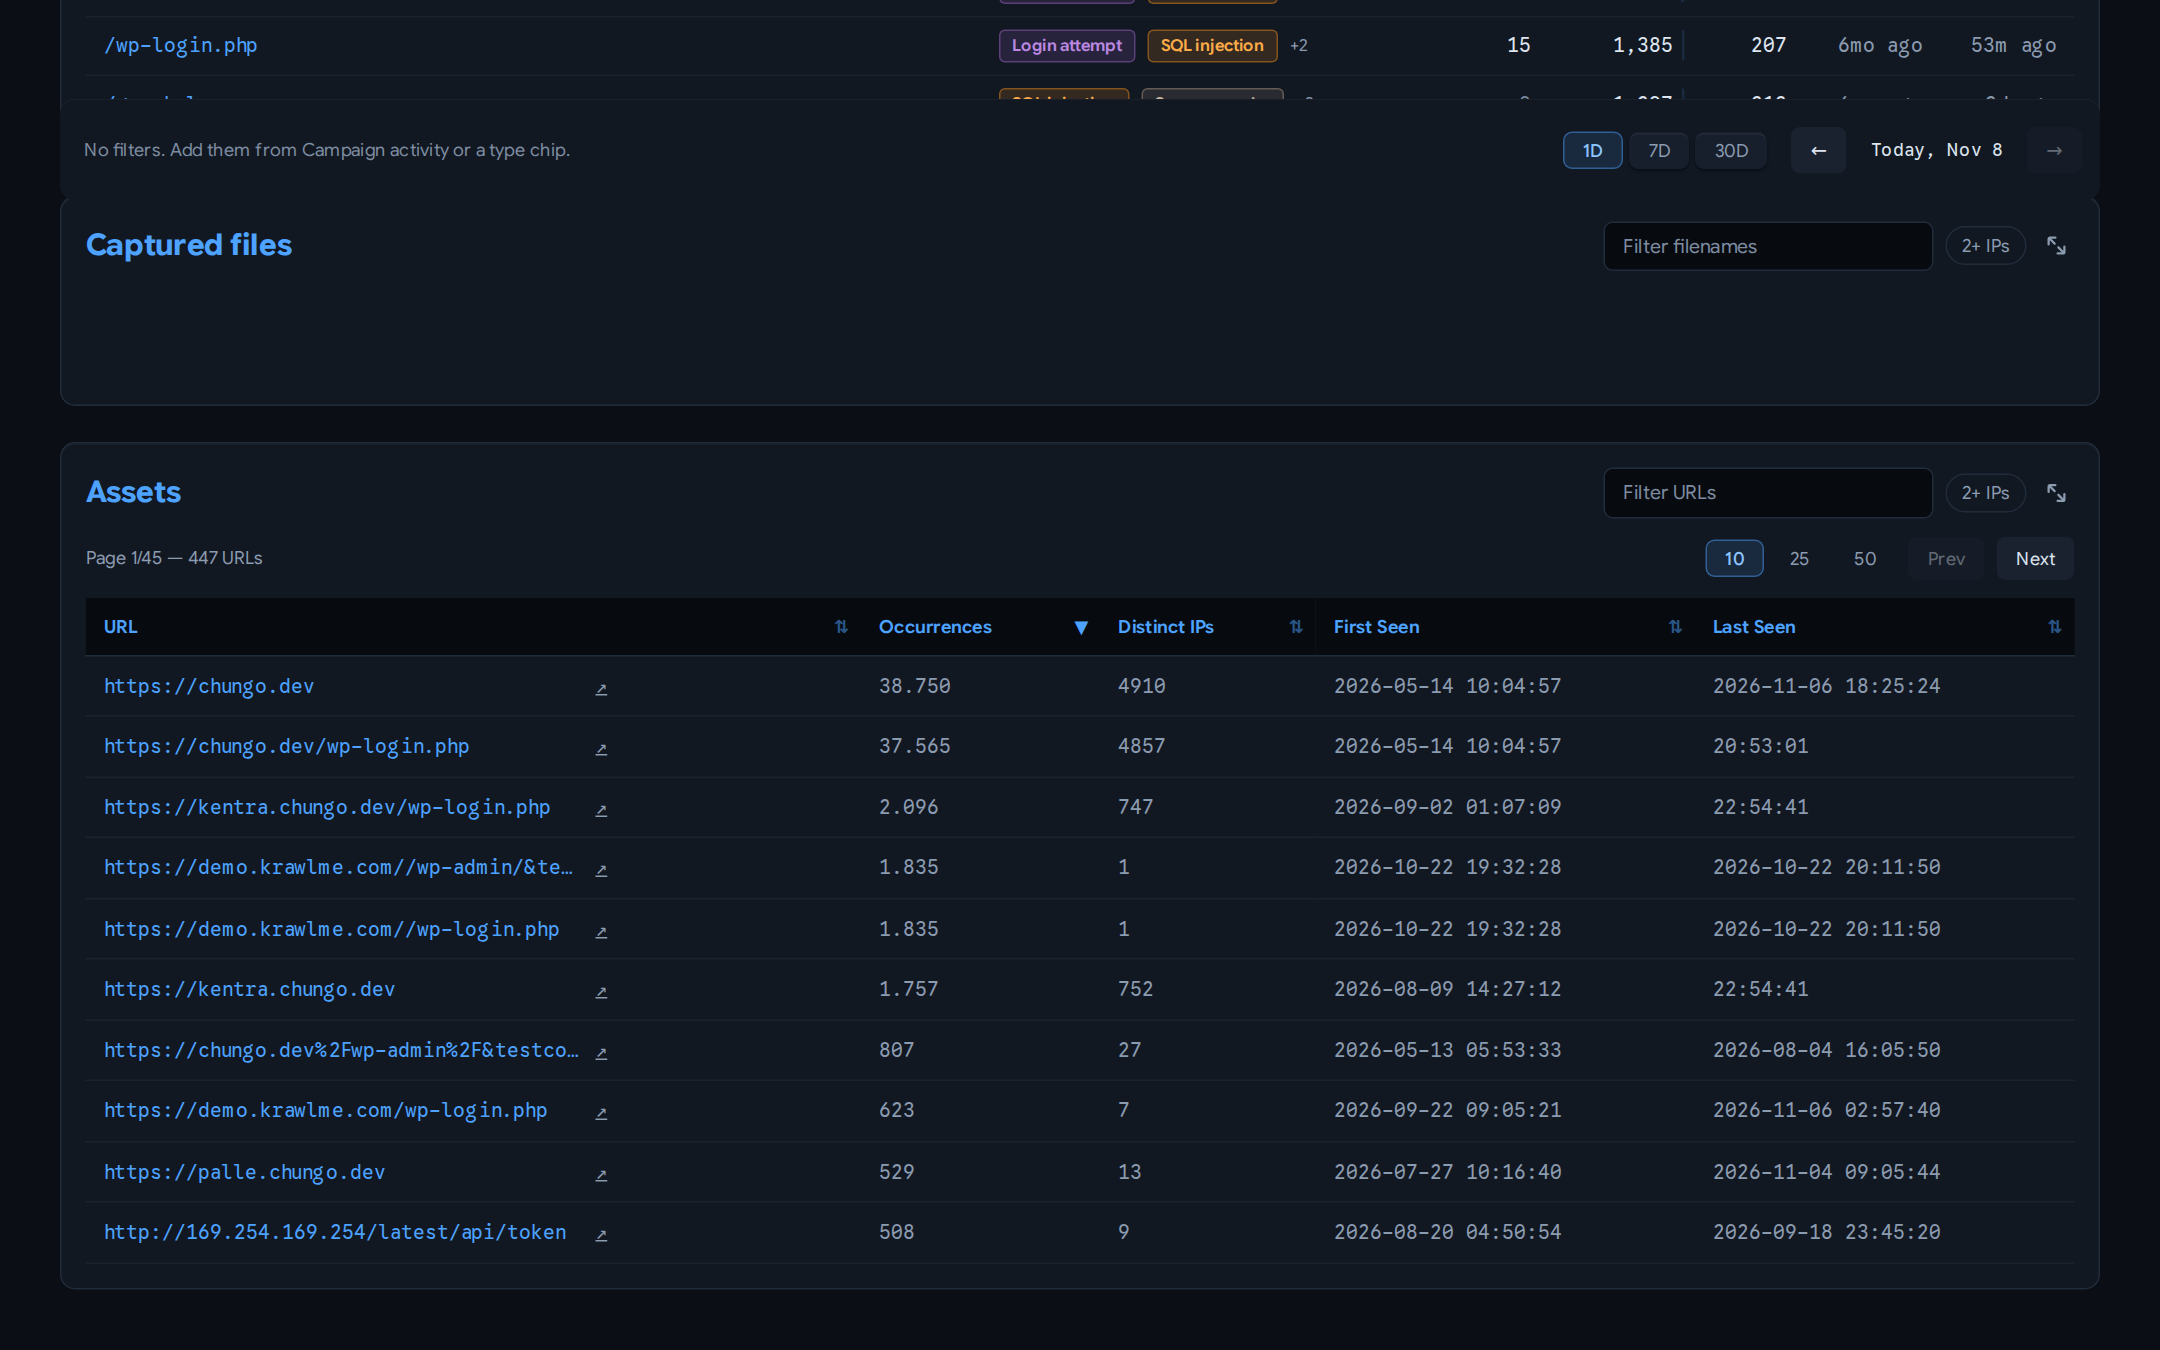
Assets
Absolute HTTP(S) URLs extracted from raw request lines, headers, and bodies,
ranked by total occurrences. Repeated appearances in one request count
separately; the table also shows distinct source IPs and first/last seen times.
The scheduled extract-request-metadata task backfills retained requests in
bounded batches after an upgrade.
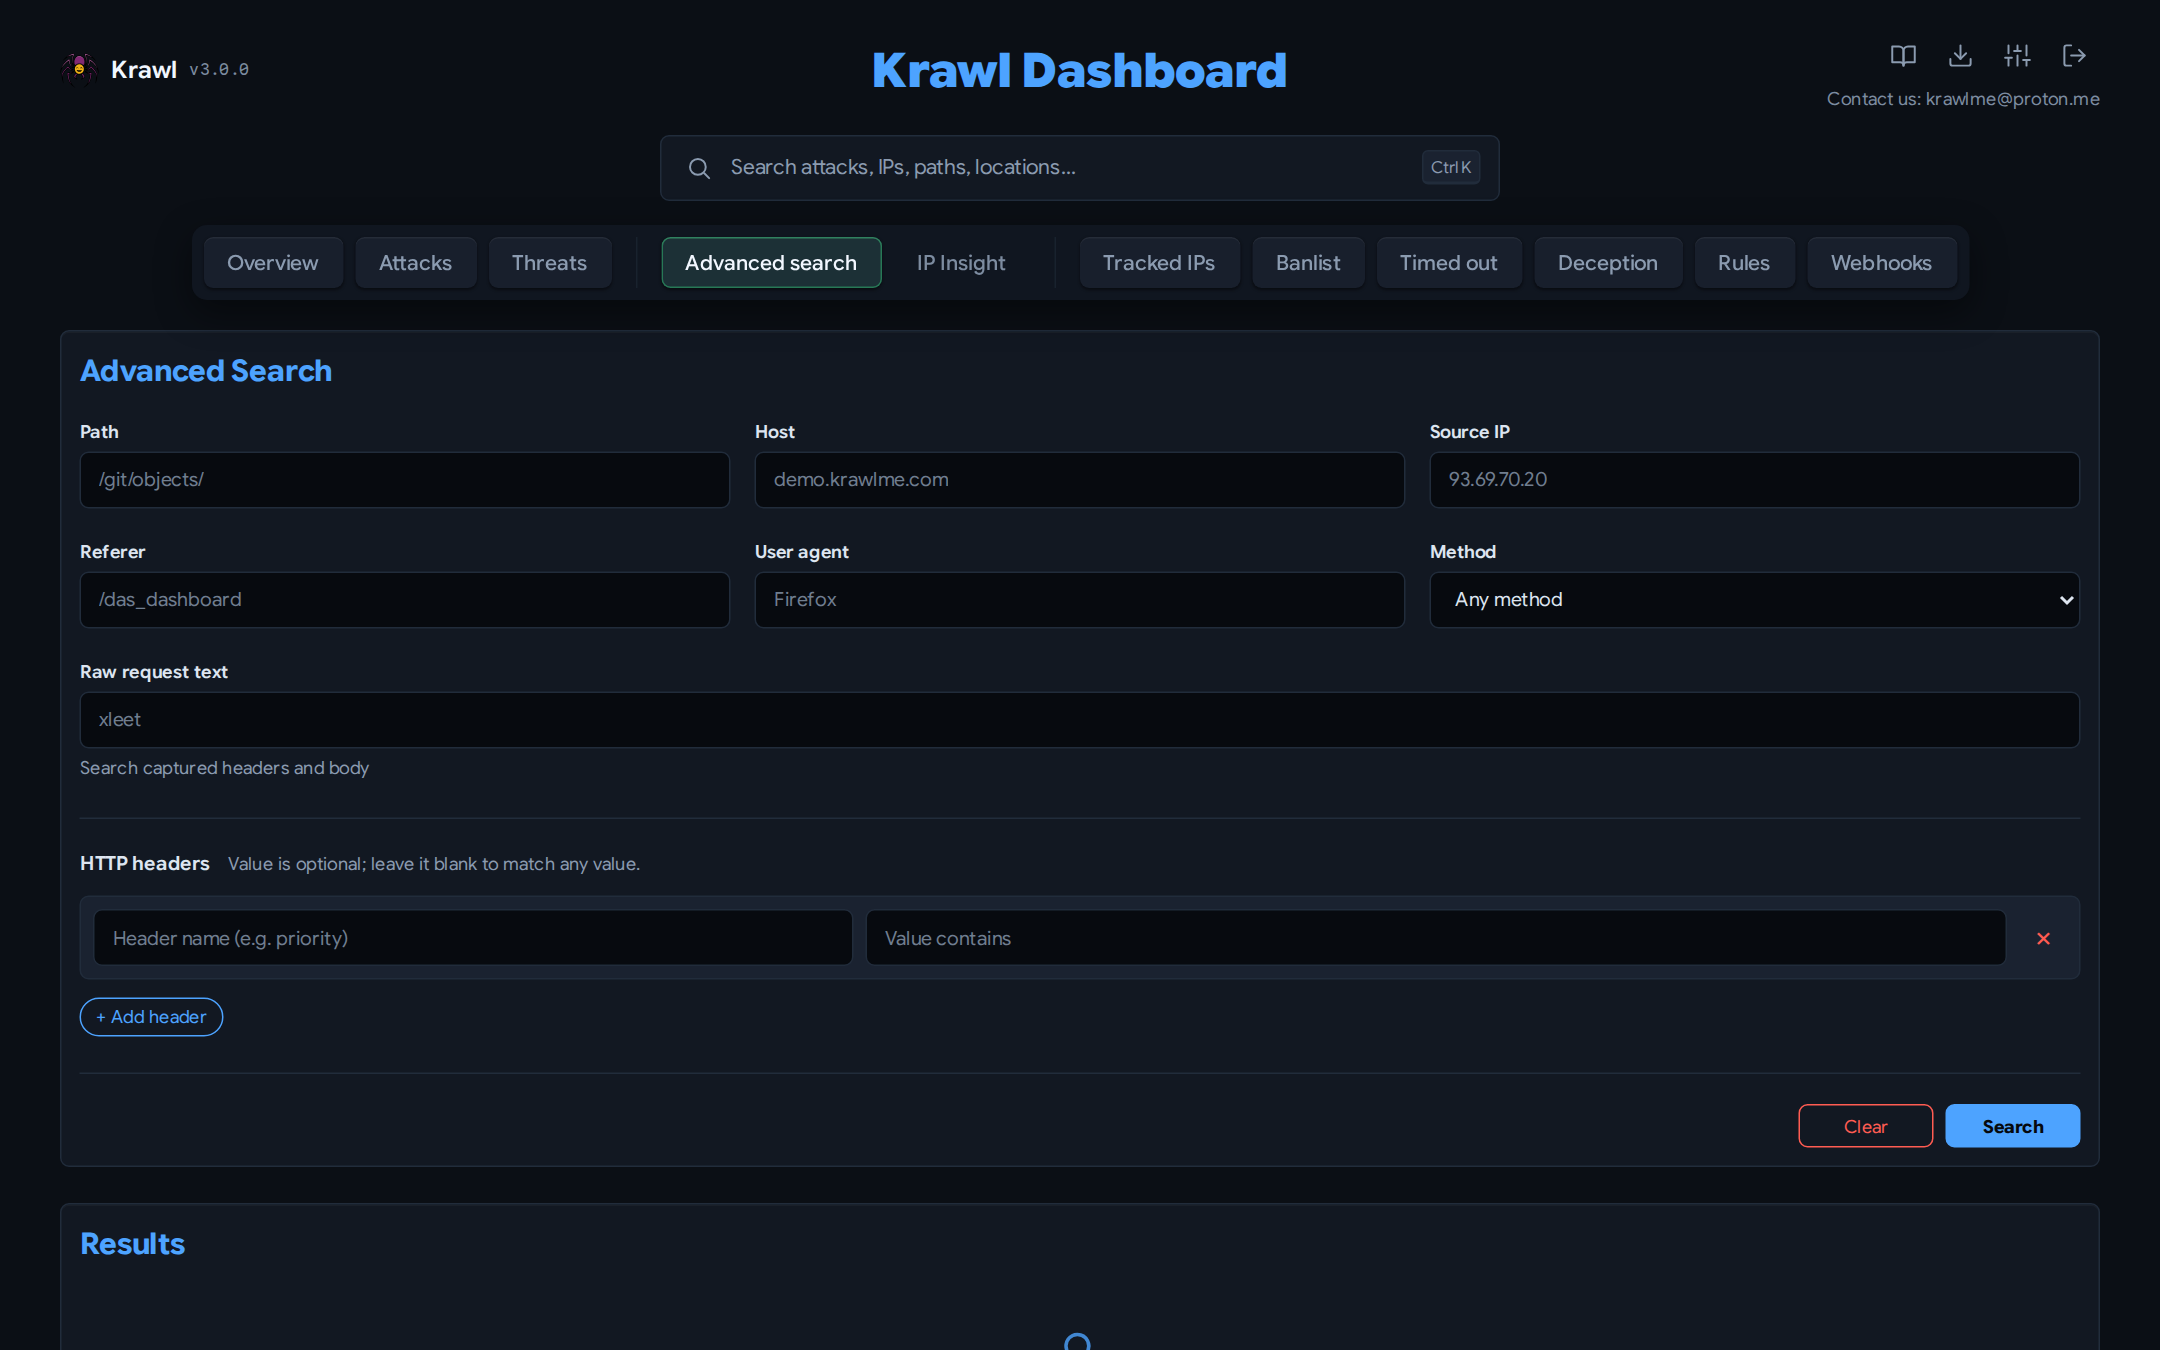
Advanced search
Finds stored requests by any combination of path, Host, source IP, referer,
user agent, method, text in the raw request (headers and body), and any number
of HTTP headers by name and optional value. Each result opens the raw request.
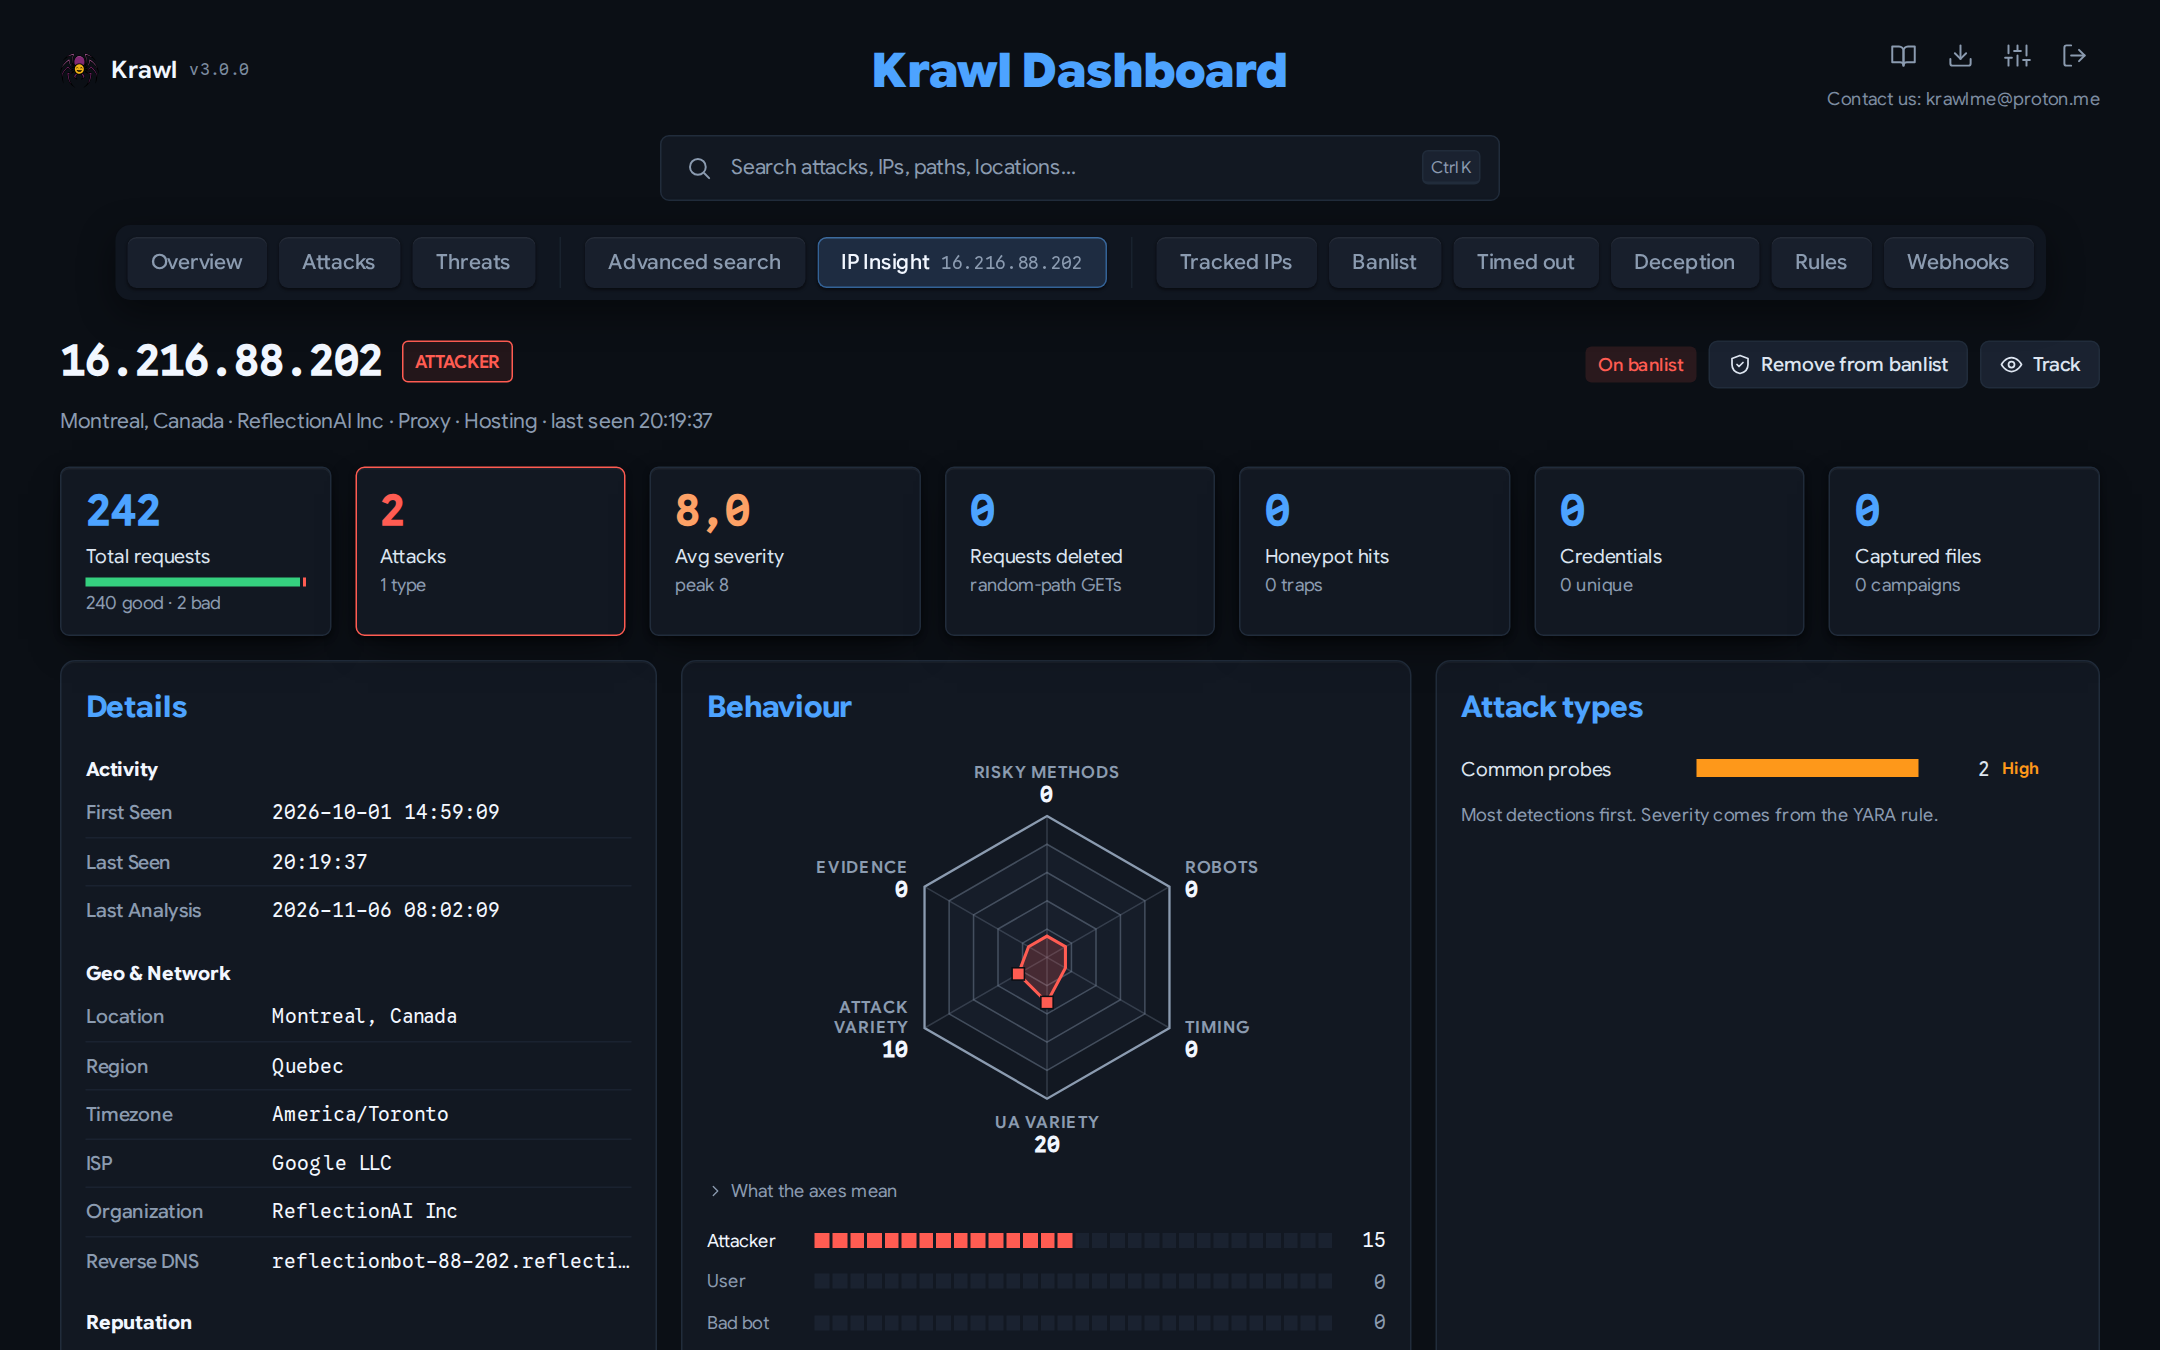
IP Insight
The IP Insight tab provides a deep-dive view for a single IP address. It opens when you select an IP address in any table, map popup or search result.
The top of the page answers what the IP is and what it did; the evidence sits in tabs below.
Totals
Seven tiles:
- Total requests — lifetime count, split into good and bad. Bad is this IP's stored suspicious requests; good is everything else
- Attacks — detections, and how many attack types they cover
- Avg severity — the average YARA rule severity (1–10) of its detections, with the highest beside it. Detections with no scored rule are left out
- Requests deleted — random-path GETs removed early, see retention
- Honeypot hits, Credentials, Captured files — with the traps, unique pairs and campaigns behind them
Attack, severity and honeypot figures cover stored requests, so they can drop when retention removes rows.
Behaviour
A hexagon scores six signals from 0 to 100: risky methods, robots violations, request timing, user-agent variety, attack variety and evidence. "What the axes mean" explains each one. An IP analysed before this view existed shows timing 0 until its next analysis.
The category points sit below it, one segment per point: the category with the most points is the IP's category. See how IPs are evaluated.
Attack Types
Attack types are ranked by detections and coloured by severity. A type no loaded rule scores shows –.
Details and Timeline
Details lists activity times, location, ISP, ASN, reverse DNS, flags and threat feeds, with the IP on a map. The Timeline shows each category change.
Evidence Tabs
Two tabs sit below, each showing its count:
- Requests — the access history, or "Only attacks" for the requests with detections. Only/Hide and the search box stack text filters, next to a method picker. Only attacks adds attack type, severity and rule, counted for this IP. These filters never touch the Attacks tab.
- Evidence — credentials and referers side by side with files below, loaded when the tab first opens.
Ban & Track Actions
The header states the IP's ban state in words: On banlist (an attacker, or banned by hand), Exempt from banlist, or Not banned. Next to it:
- Add to banlist / Remove from banlist — the confirmation says what changes: banlist exports and firewall webhooks include or leave out the IP
- Track / Stop tracking — add the IP to your watchlist for ongoing monitoring
The buttons are always shown. When you are logged out they are marked "Log in to act", and pressing one asks for the dashboard password.
Blocklist Memberships
Shows which threat intelligence feeds list the IP, one chip per feed, with the total count first. Past six feeds the rest fold behind a "more" toggle.
Referers
The Referer headers this IP arrived with, so you can see which bait link, page
or external source led it here. Empty unless analyzer.referer_enabled is on.
Files
Files this IP uploaded or requested, with the TLSH digest that ties each one to a campaign. A file opens in place rather than downloading.
Credentials
The usernames and passwords this IP submitted to the login traps, filtered to this address alone.
Access History
A filtered view of all requests made by this specific IP, with full request details. The tables on this tab drop their IP column — every row is the address the tab is already about.
Tracked IPs
Requires authentication with the dashboard password.
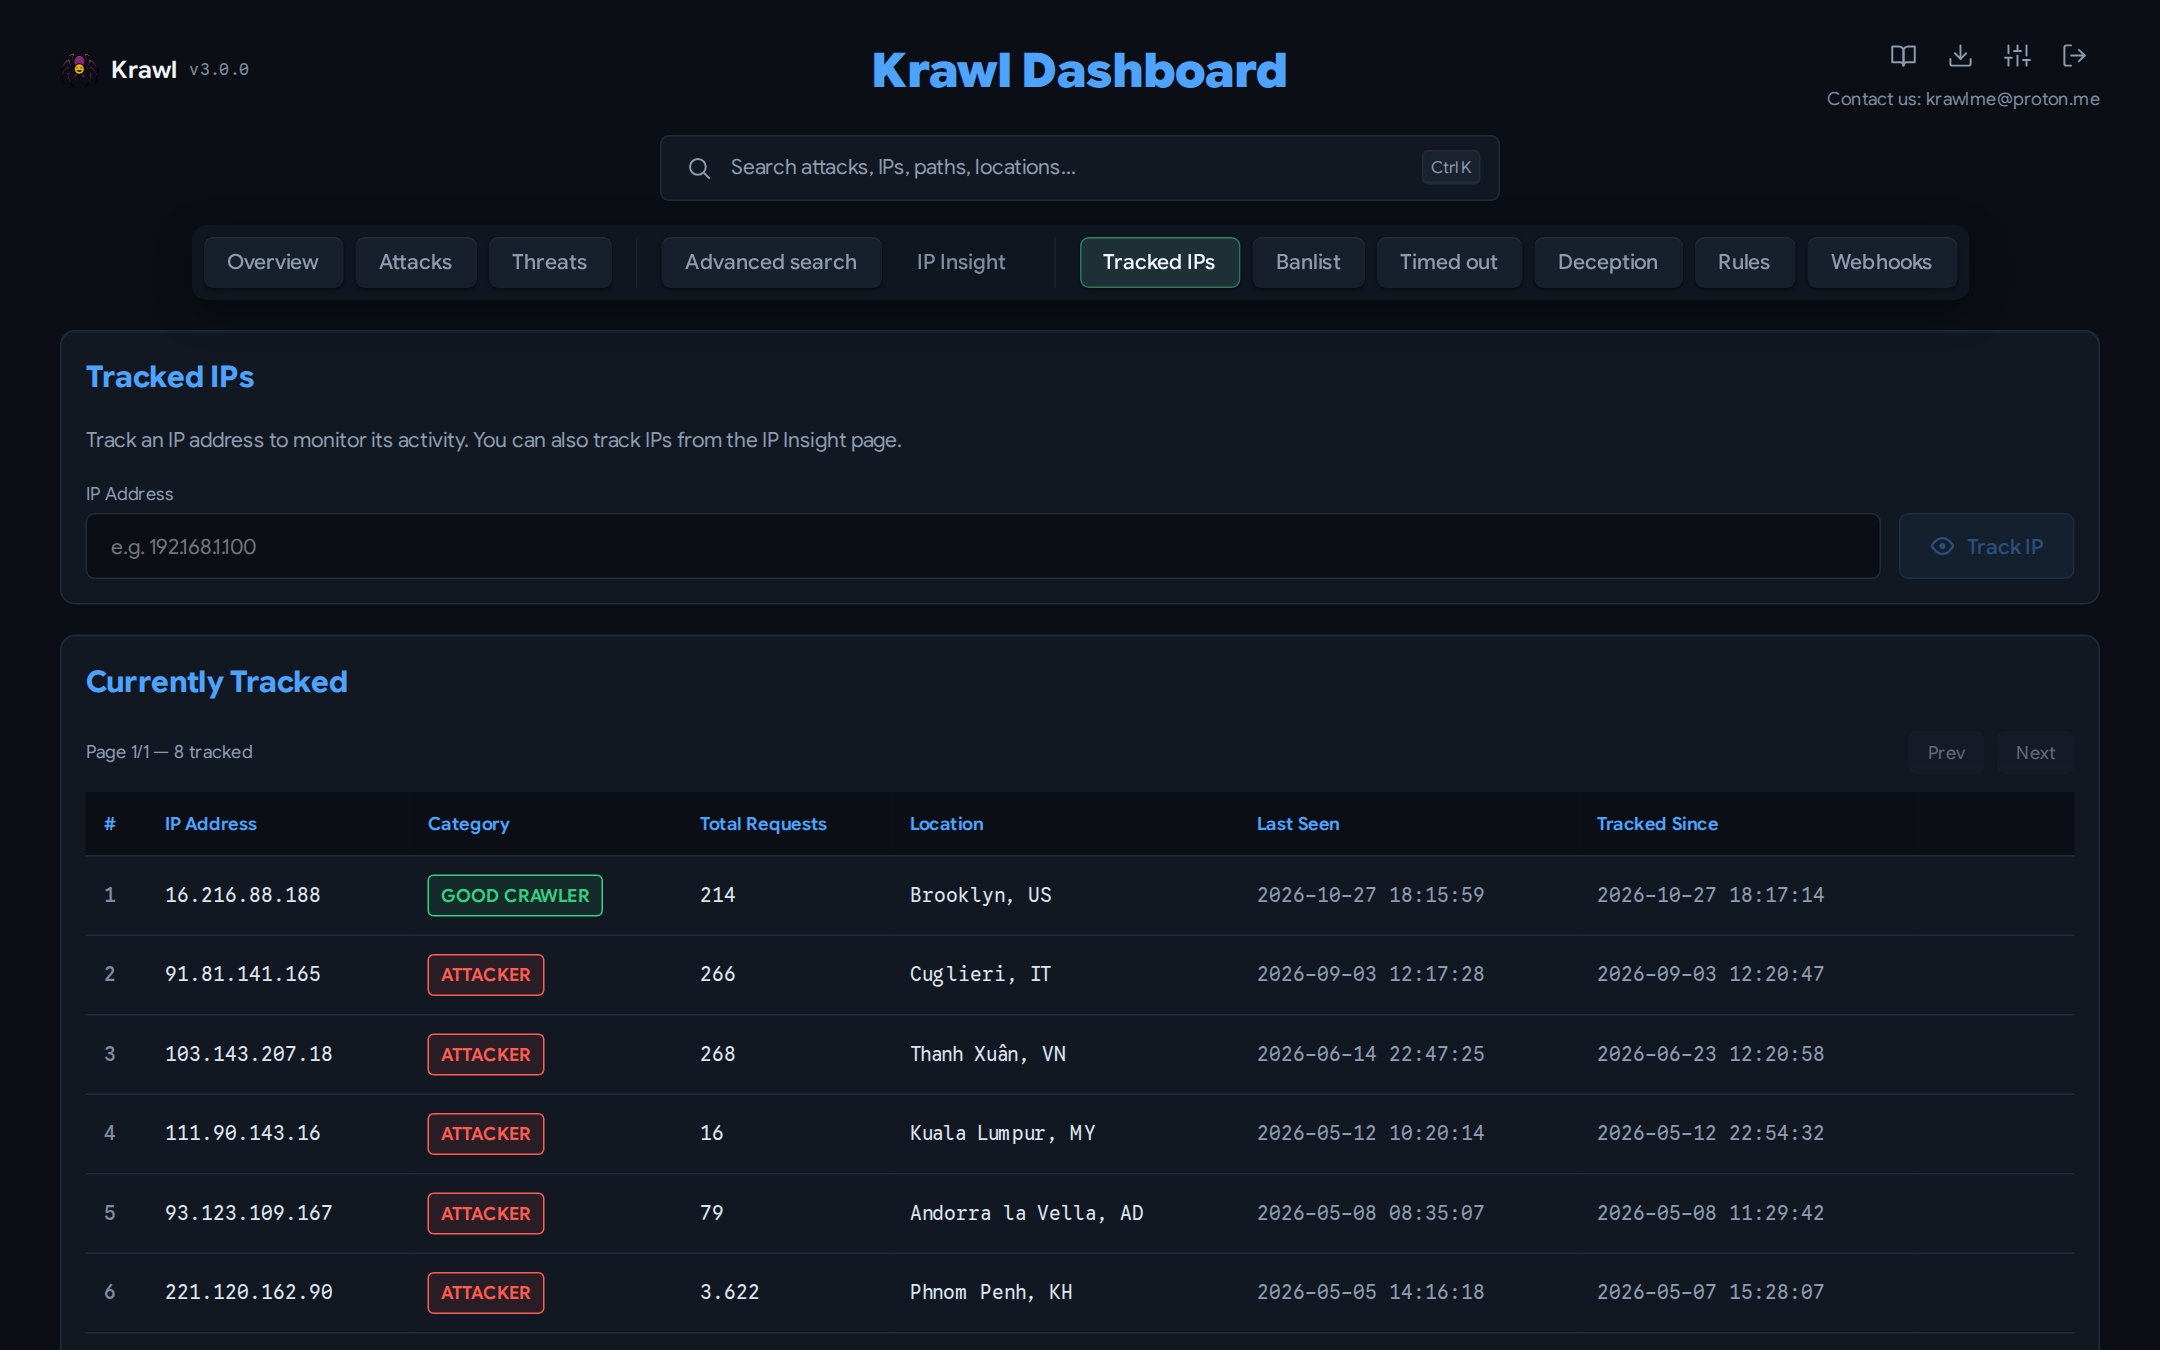
The Tracked IPs tab lets you maintain a watchlist of IP addresses you want to monitor over time.
Track New IP
A form to add any IP address to your tracking list for ongoing observation.
Currently Tracked IPs
A paginated table of all manually tracked IPs, with the option to untrack each one.
IP Banlist
Requires authentication with the dashboard password.
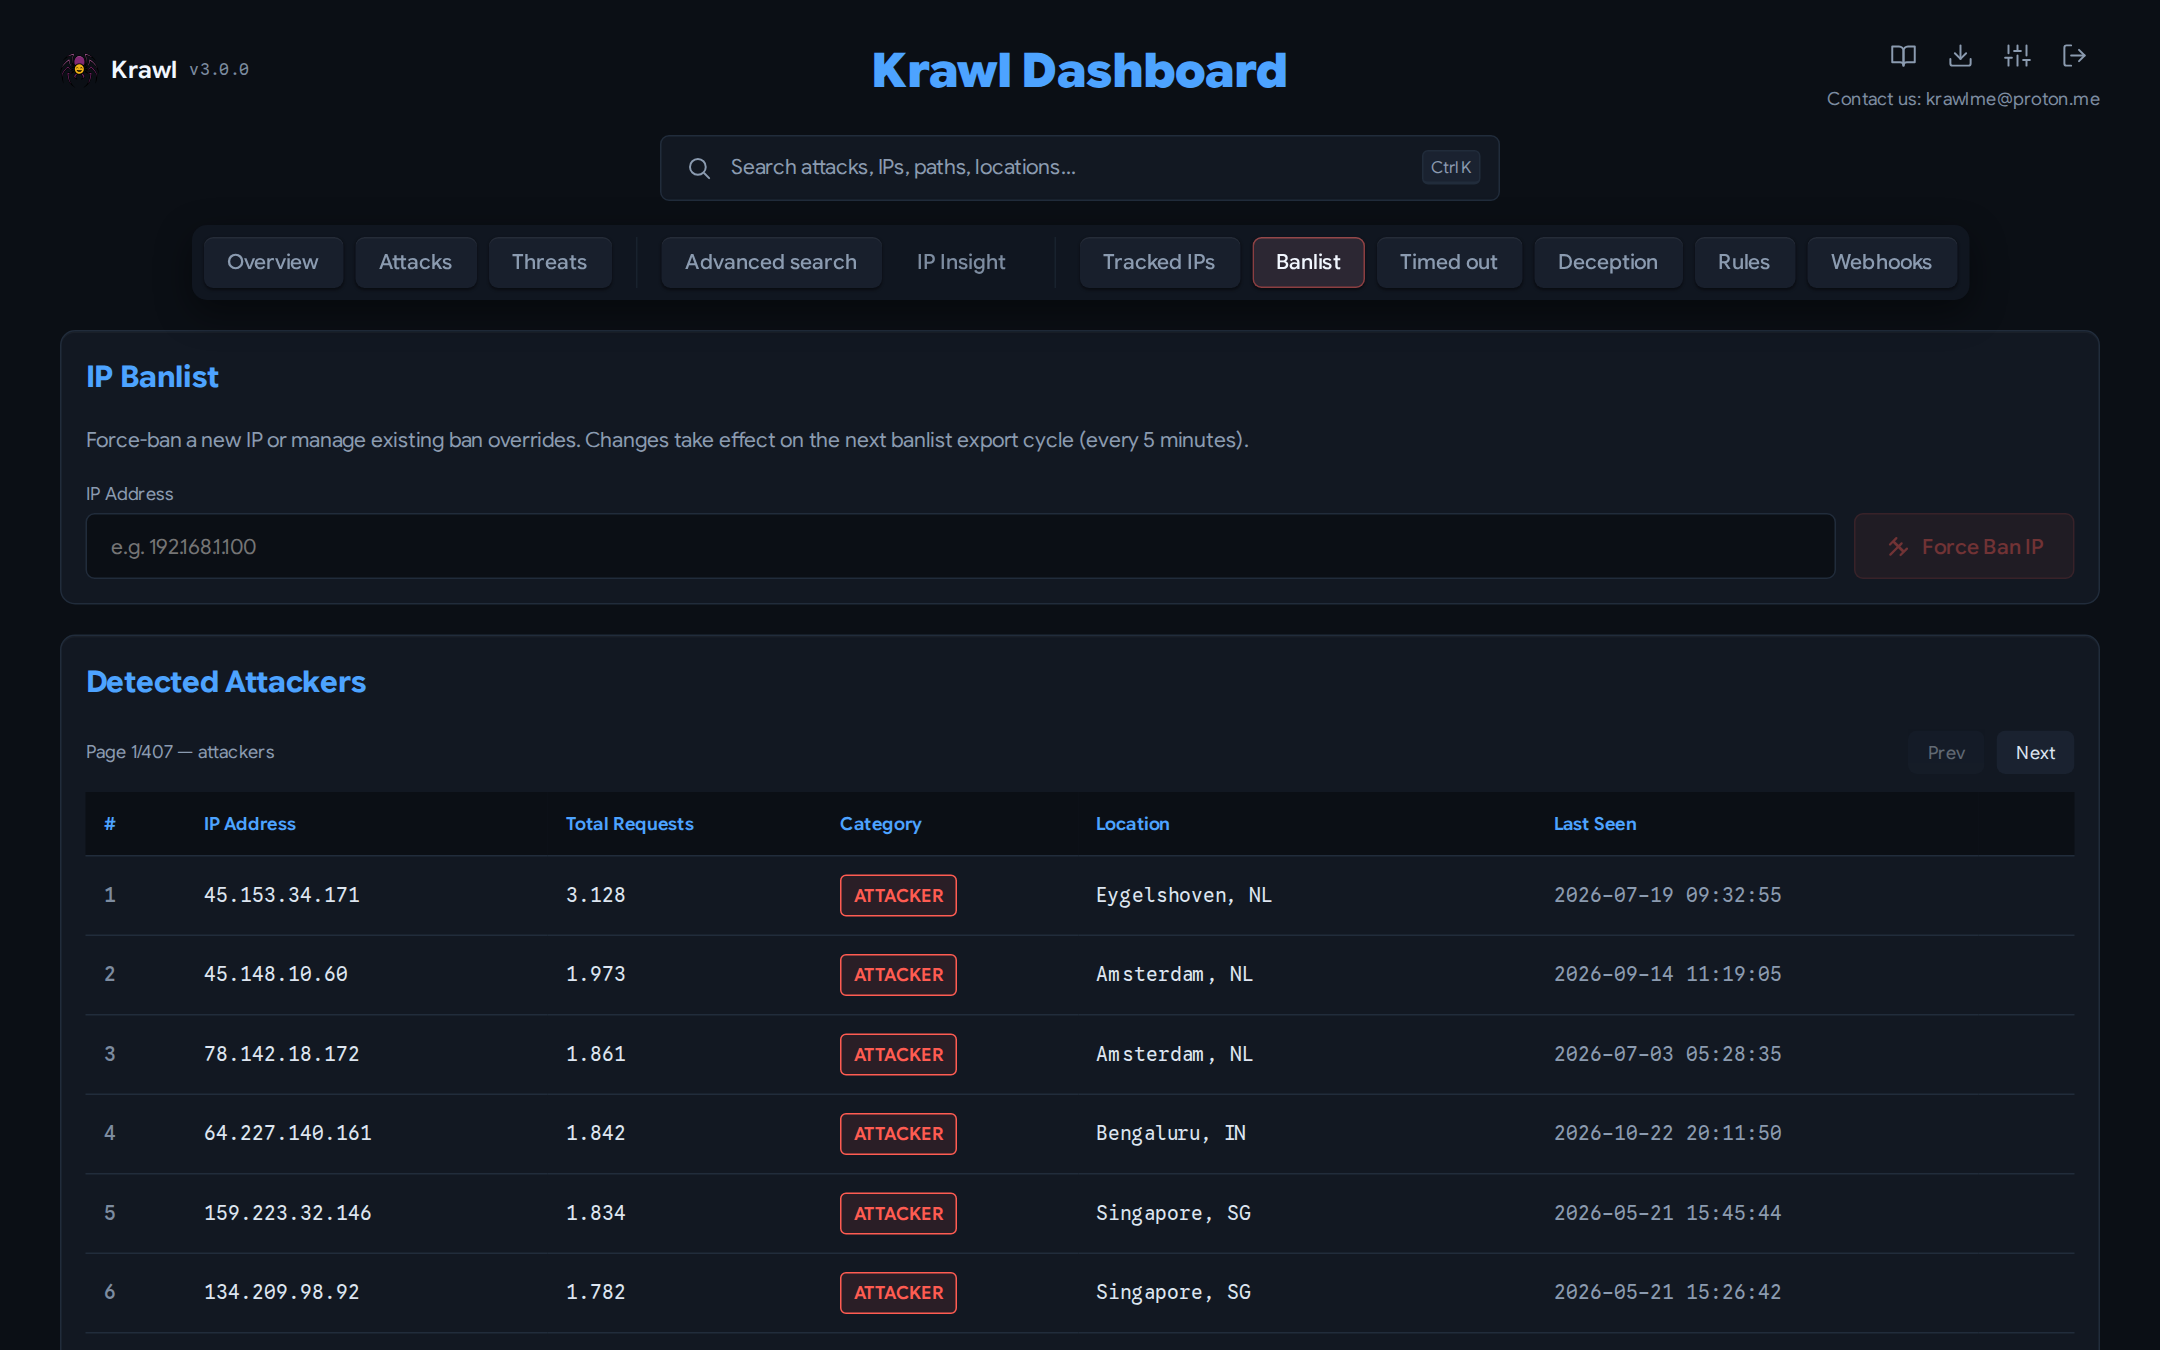
The IP Banlist tab provides tools for managing IP bans. Bans are exported every 5 minutes.
Force Ban IP
A form to immediately ban any IP address by entering it manually.
Detected Attackers
A paginated list of all IPs detected as attackers, with quick-ban actions for each entry.
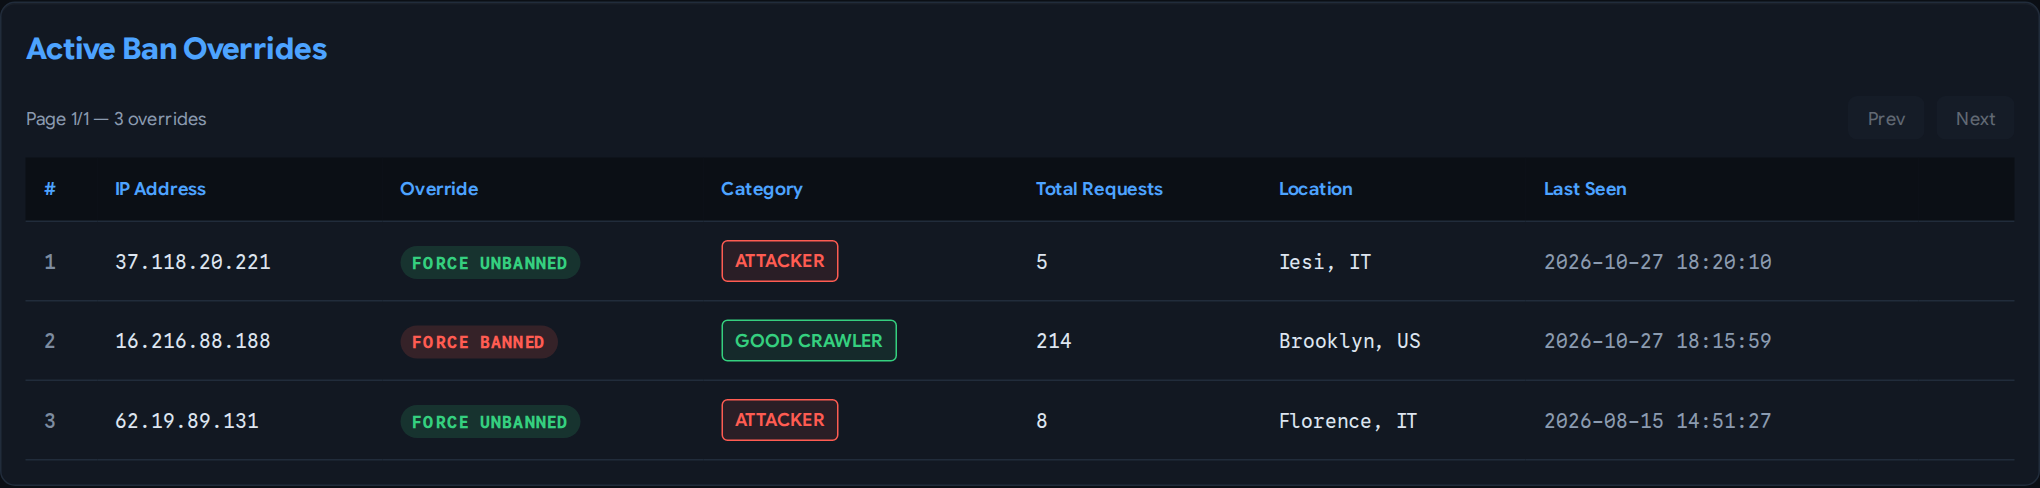
Active Ban Overrides
A table of currently active manual ban overrides, with options to unban or reset the override status for each IP.
Export Banlist
A dropdown menu to download the current banlist in two formats:
- Raw IPs List — plain text, one IP per line
- IPTables Rules — ready-to-use firewall rules
Timed out
Requires authentication with the dashboard password.
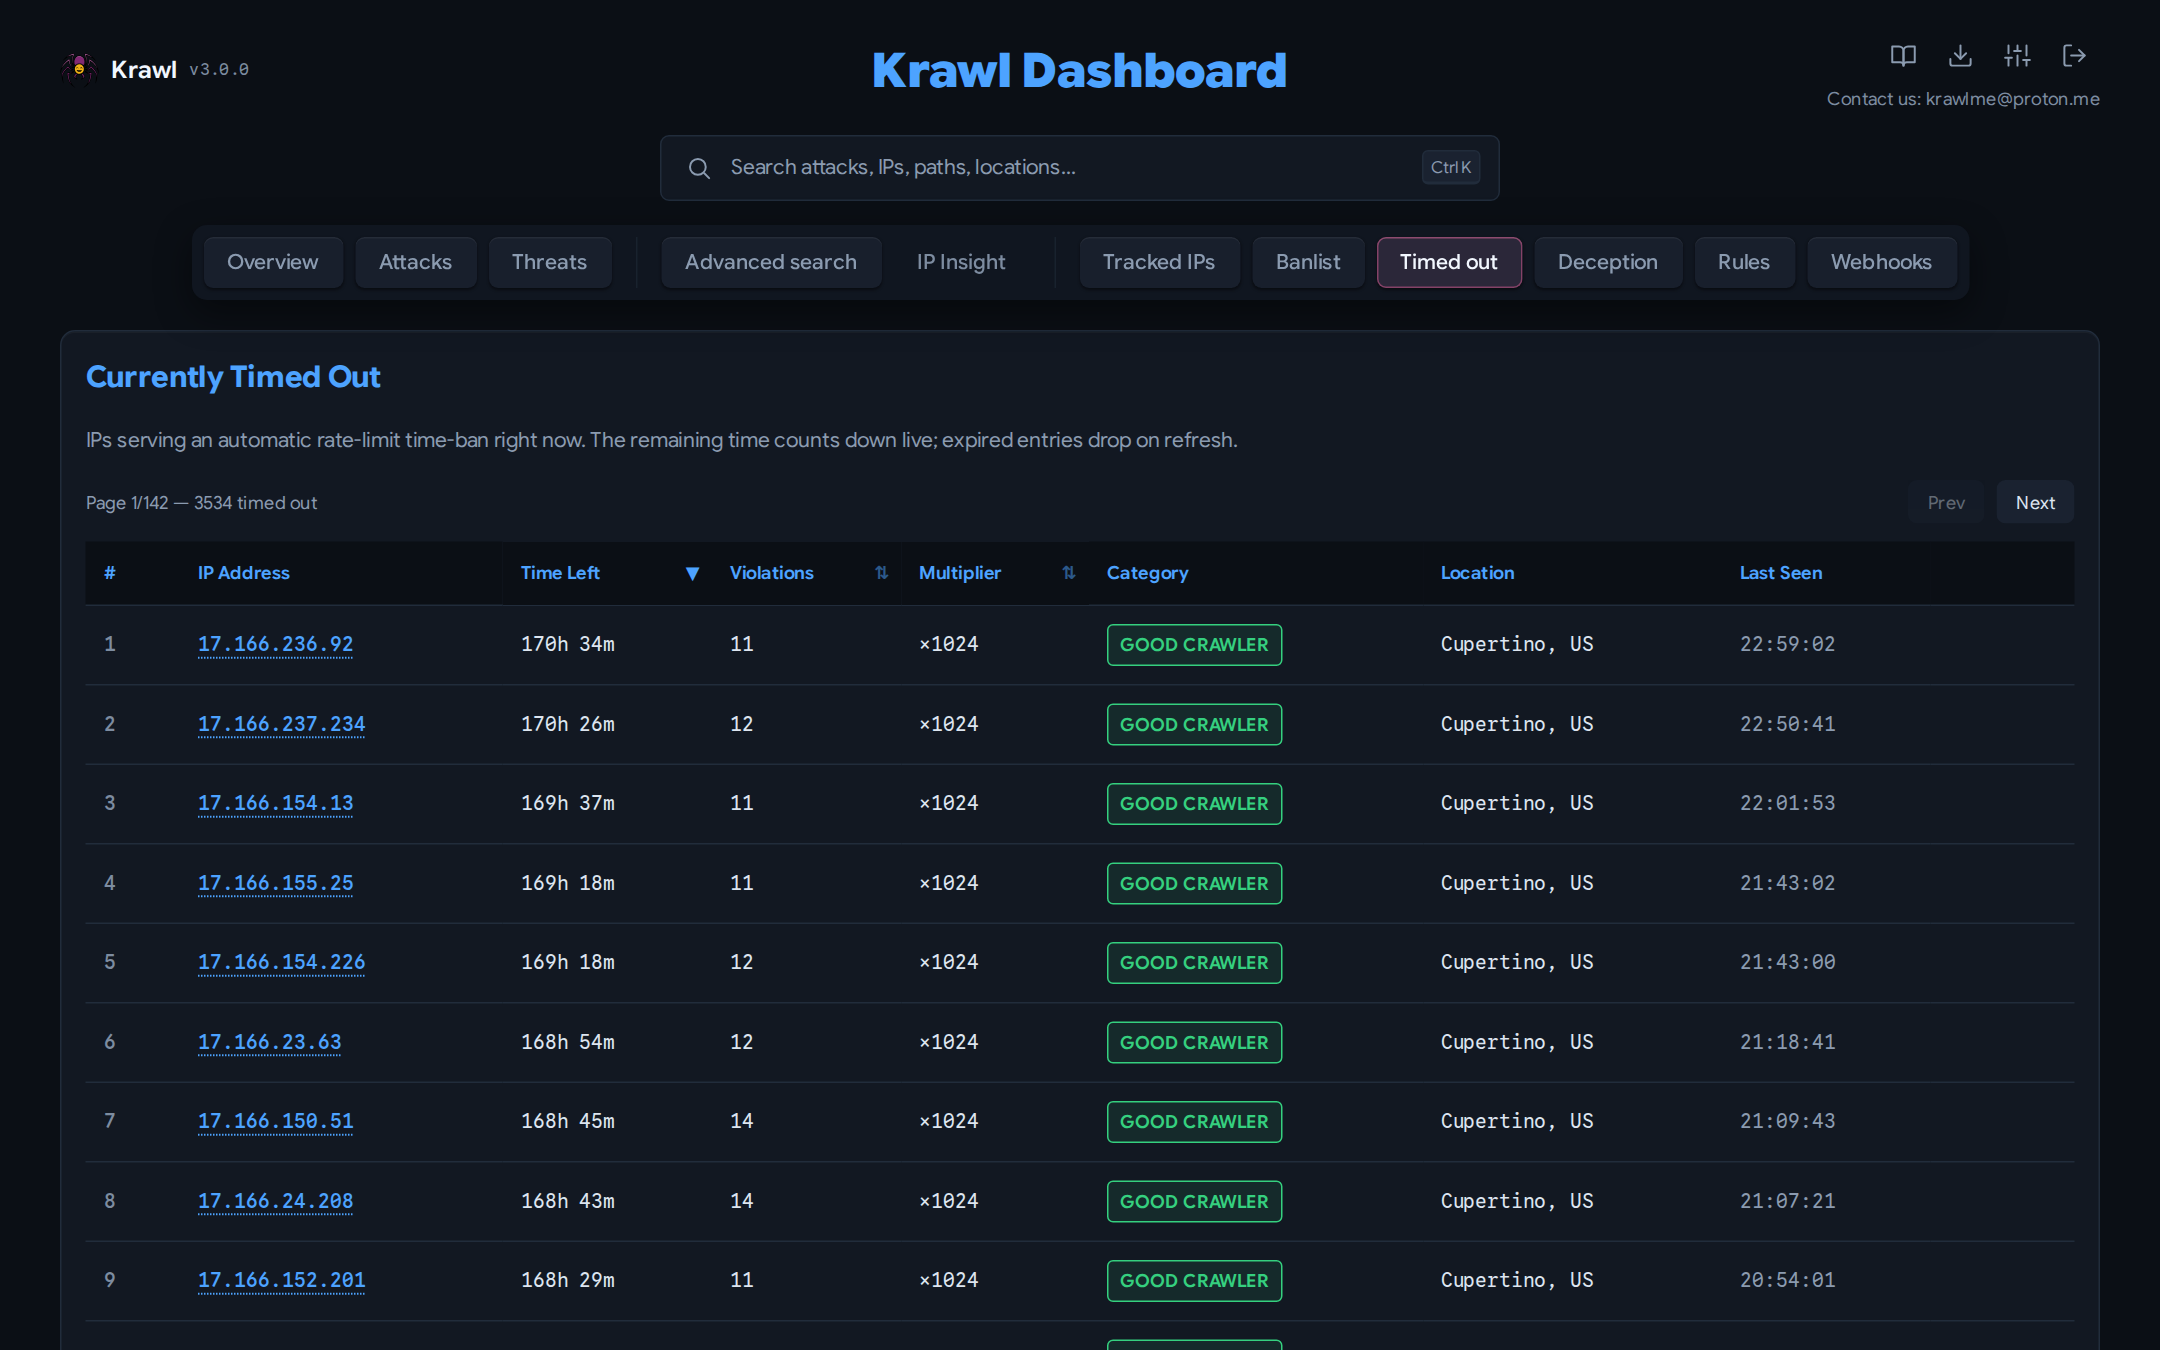
Currently Timed Out lists the IPs serving an automatic rate-limit time-ban: time left (counting down live), violations, ban multiplier, category, location and last seen. Timeout-Exempt IPs lists the IPs excluded from time-bans, each with a button to subject it to timeouts again. See Tarpit.
Deception
Requires authentication with the dashboard password.
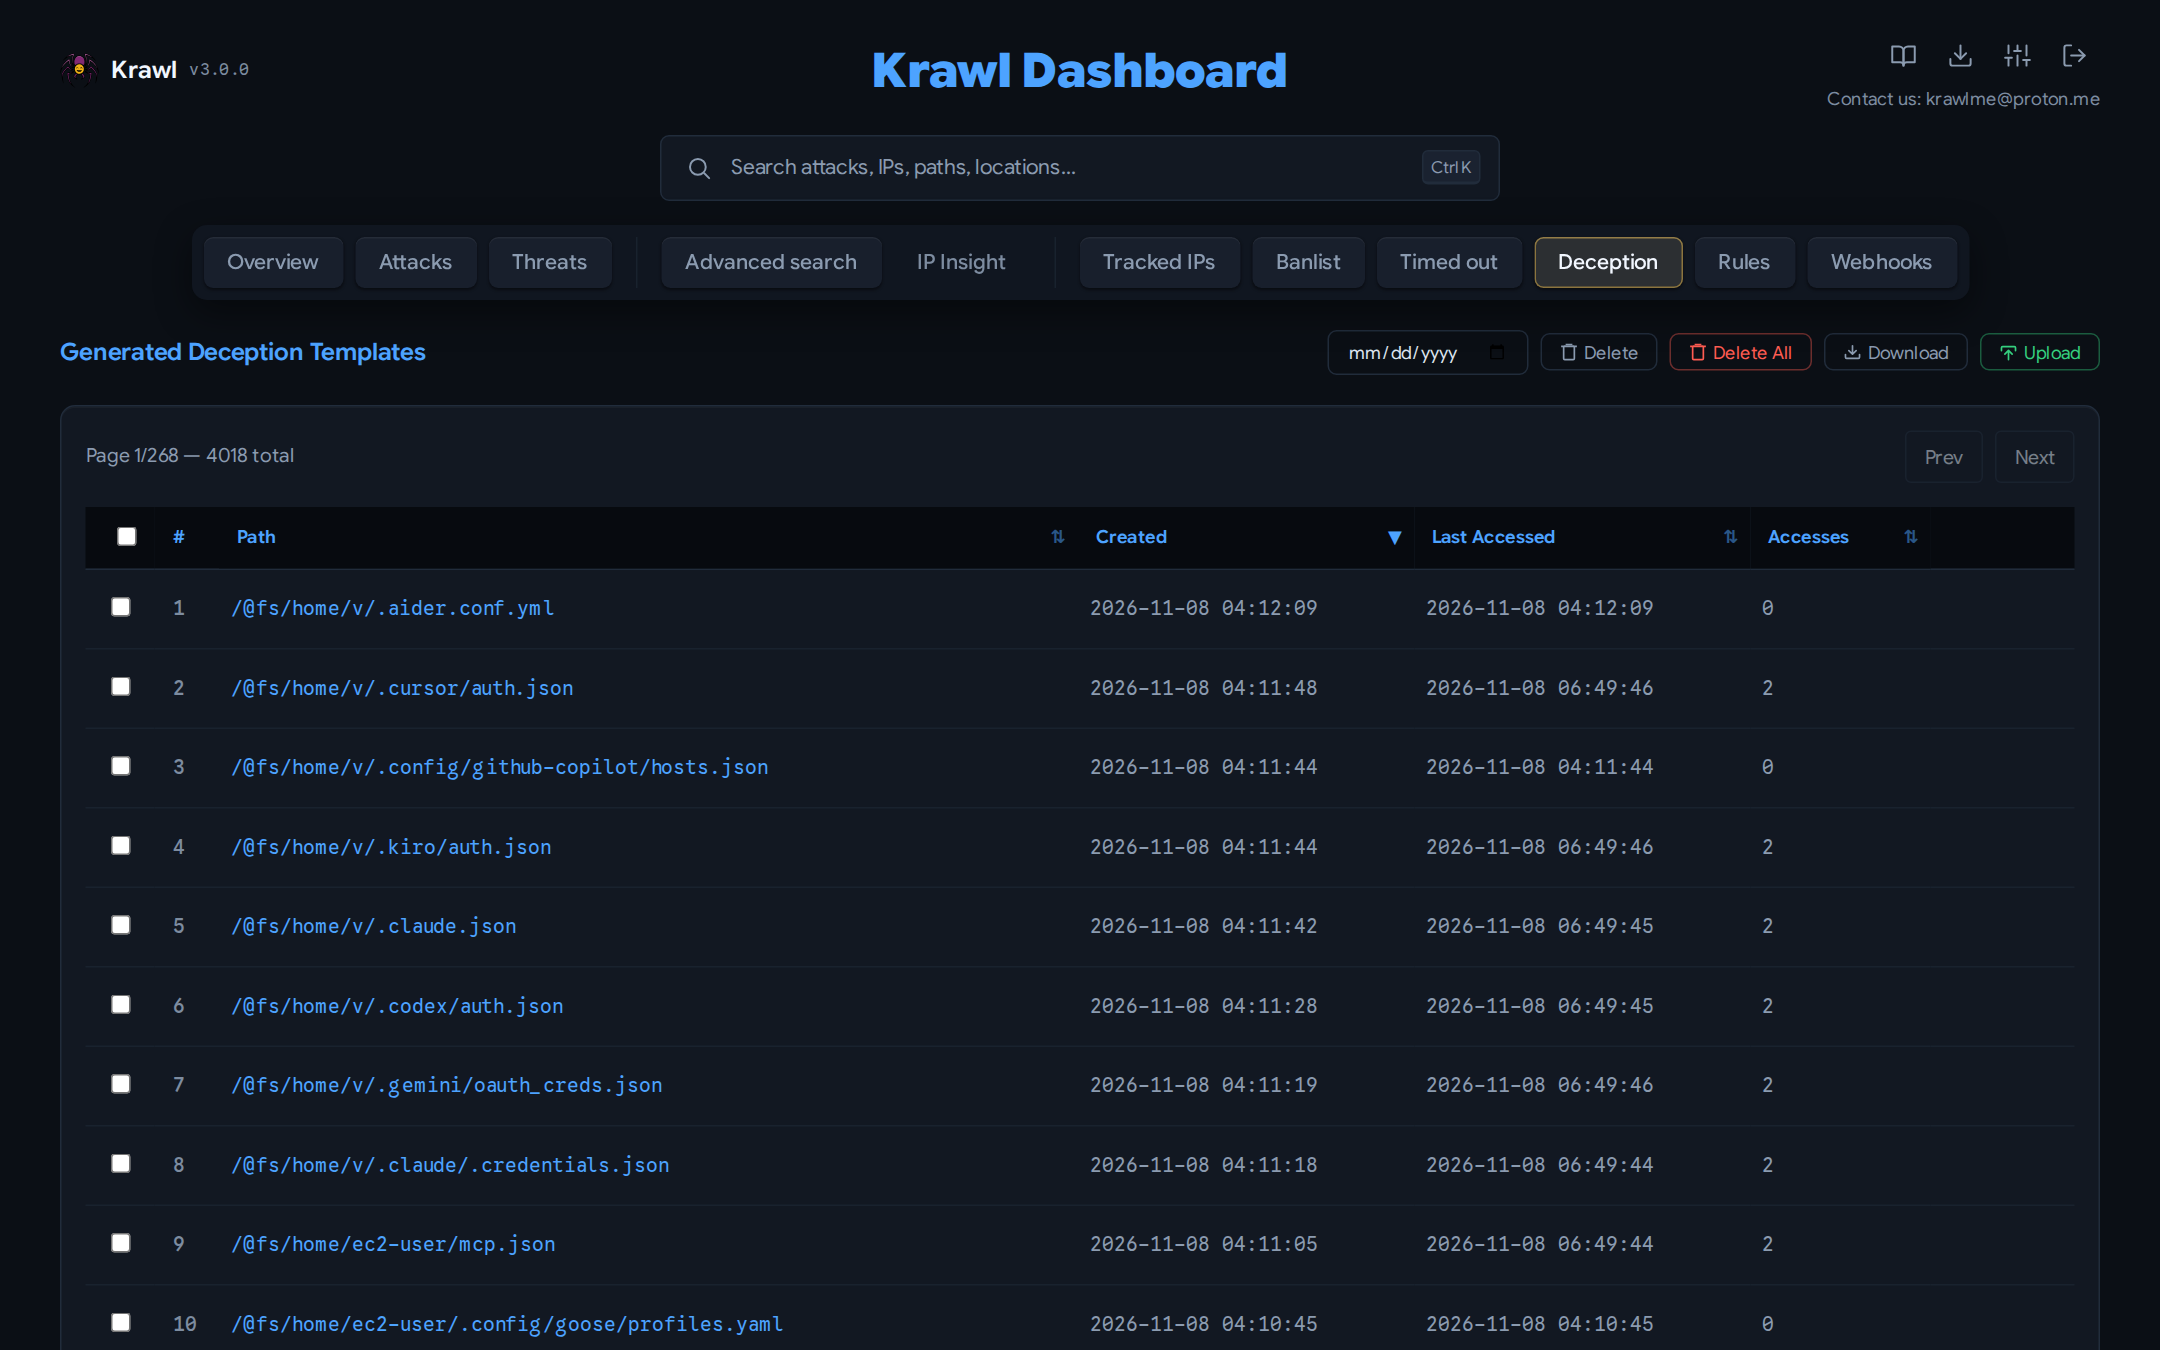
Generated Deception Templates lists every page Krawl generated or you uploaded, with when it was created, last accessed, and how often. Select rows or pick a date to Delete or Download them, Delete All, or Upload your own. See Deception pages and AI generation.
Rules
Requires authentication with the dashboard password.
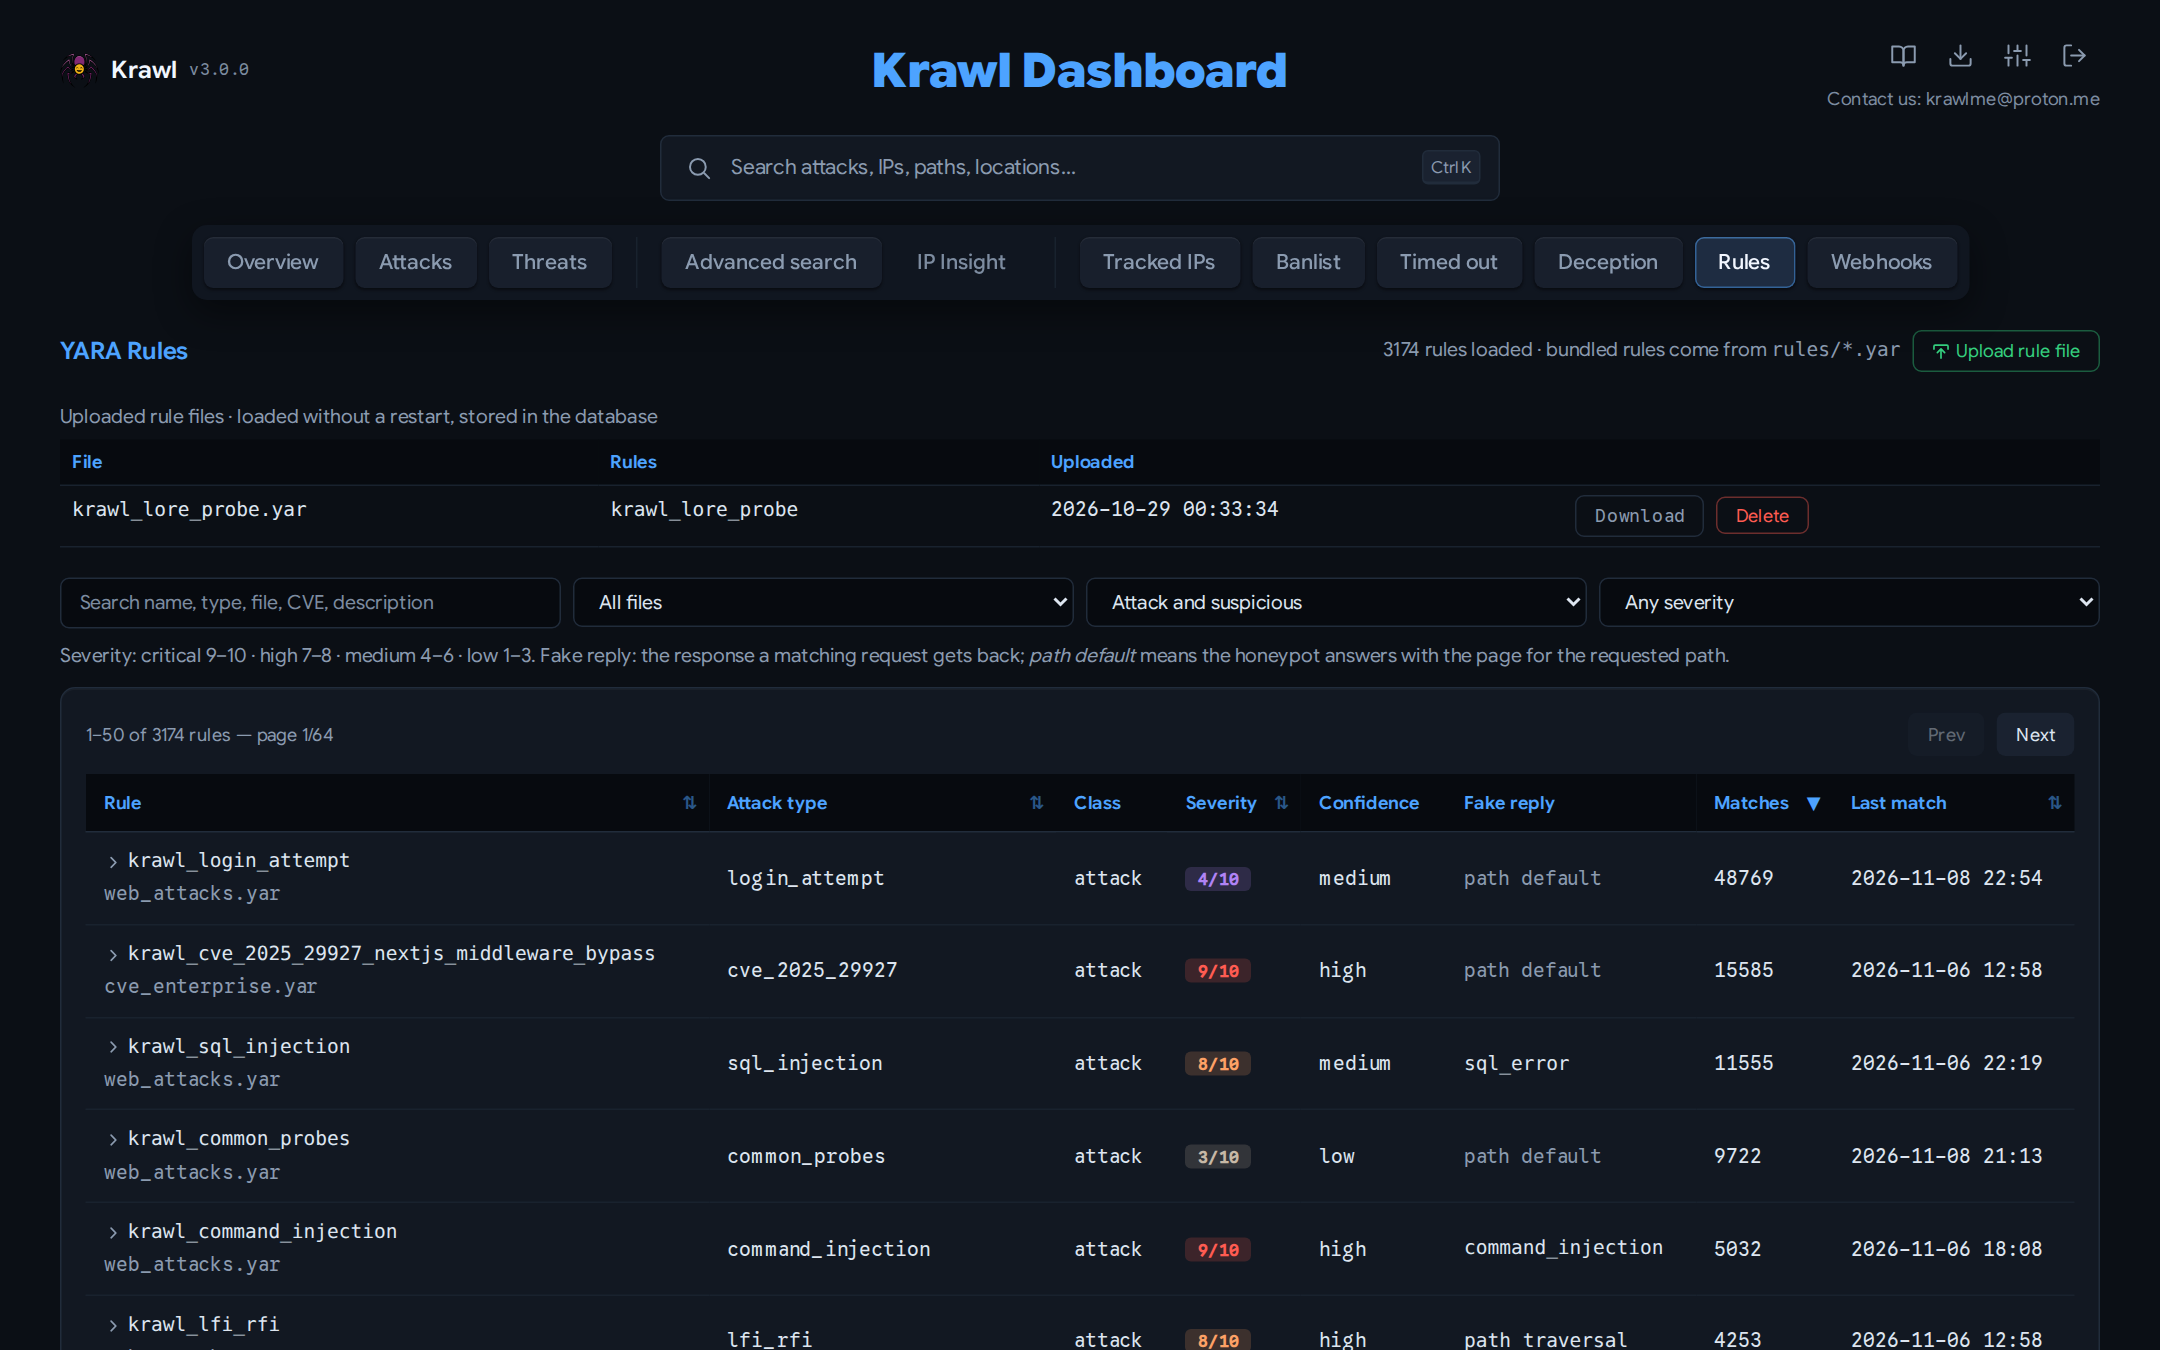
The Rules tab lists every YARA rule loaded at startup, read-only. Each row shows
the rule name and file, attack type, classification, severity, confidence, the
fake reply it triggers (response_type, or route when the normal page
answers), how many stored detections it produced and when it last matched.
Click a row for the rule card: description, MITRE ATT&CK techniques and CVEs
(linked), known false positives and references, and the 20 newest requests the
rule matched, with time, IP, method, path and the matched text. Click the
<> button to open the raw request, or the IP to open IP Insight. Requests
stored before rule names were recorded are marked legacy; they are listed
under a rule only when it is the only loaded rule of their attack type.
Filter by rule file, classification or minimum severity, sort by clicking the Rule, Attack type, Severity, Matches or Last match header, and type in the search box to find rules by name, attack type, file, CVE or description. The table shows 50 rules per page; search, filters and sorting run on the server.
Upload rule file adds a .yar file of your own; its rules are live at
once, without a restart, and listed under Uploaded rule files with
Download and Delete buttons. A file that does not compile or breaks a
rule (duplicate name, missing metadata, unknown reply type, too slow) is
rejected with the reason. See
Uploading rules from the dashboard.
Bundled rules are read-only here: to change them, edit the files under
rules/ and restart Krawl; see Attack detection.
Counts come from attack_detections.rule_name. Detections stored before Krawl
recorded the rule name count toward a rule only when its attack type belongs to
that one rule, so rules that share a type (the two path-traversal rules) count
from the upgrade on.
Webhooks
Requires authentication with the dashboard password.
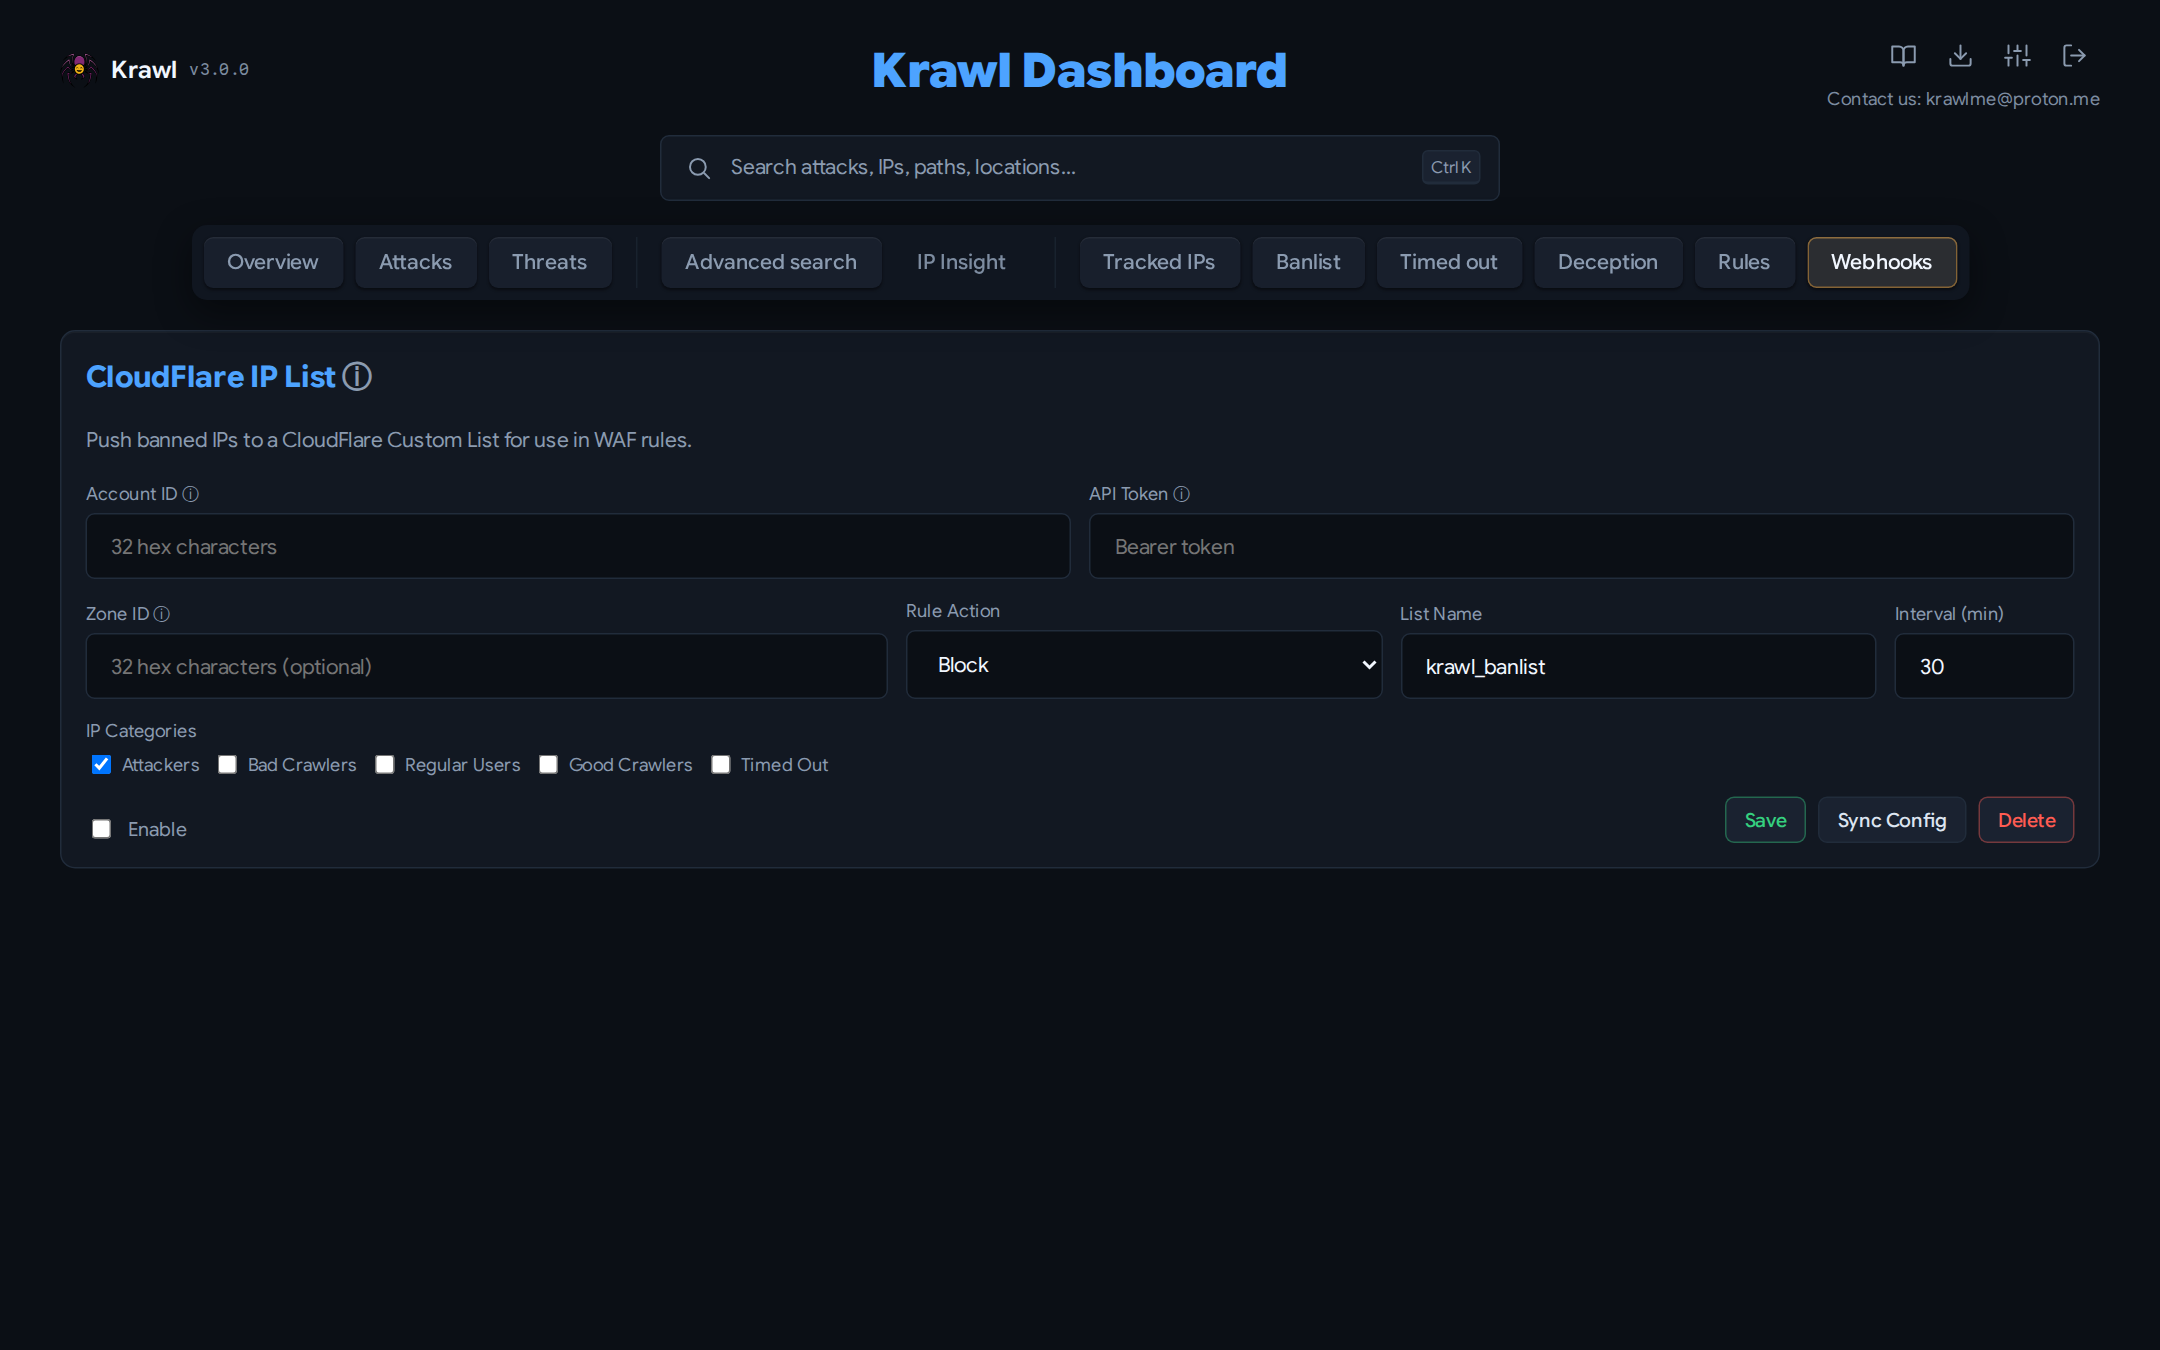
Pushes banned IPs to a Cloudflare custom IP list for use in WAF rules: account ID, API token, optional zone ID, rule action, list name, sync interval, and which IP categories to include. Sync Config pushes immediately. See Cloudflare banlist.
Settings
The sliders icon in the header opens Settings (log in first).
- Maintenance runs any scheduled task on demand and shows which pod last ran each one; see Deployment modes.
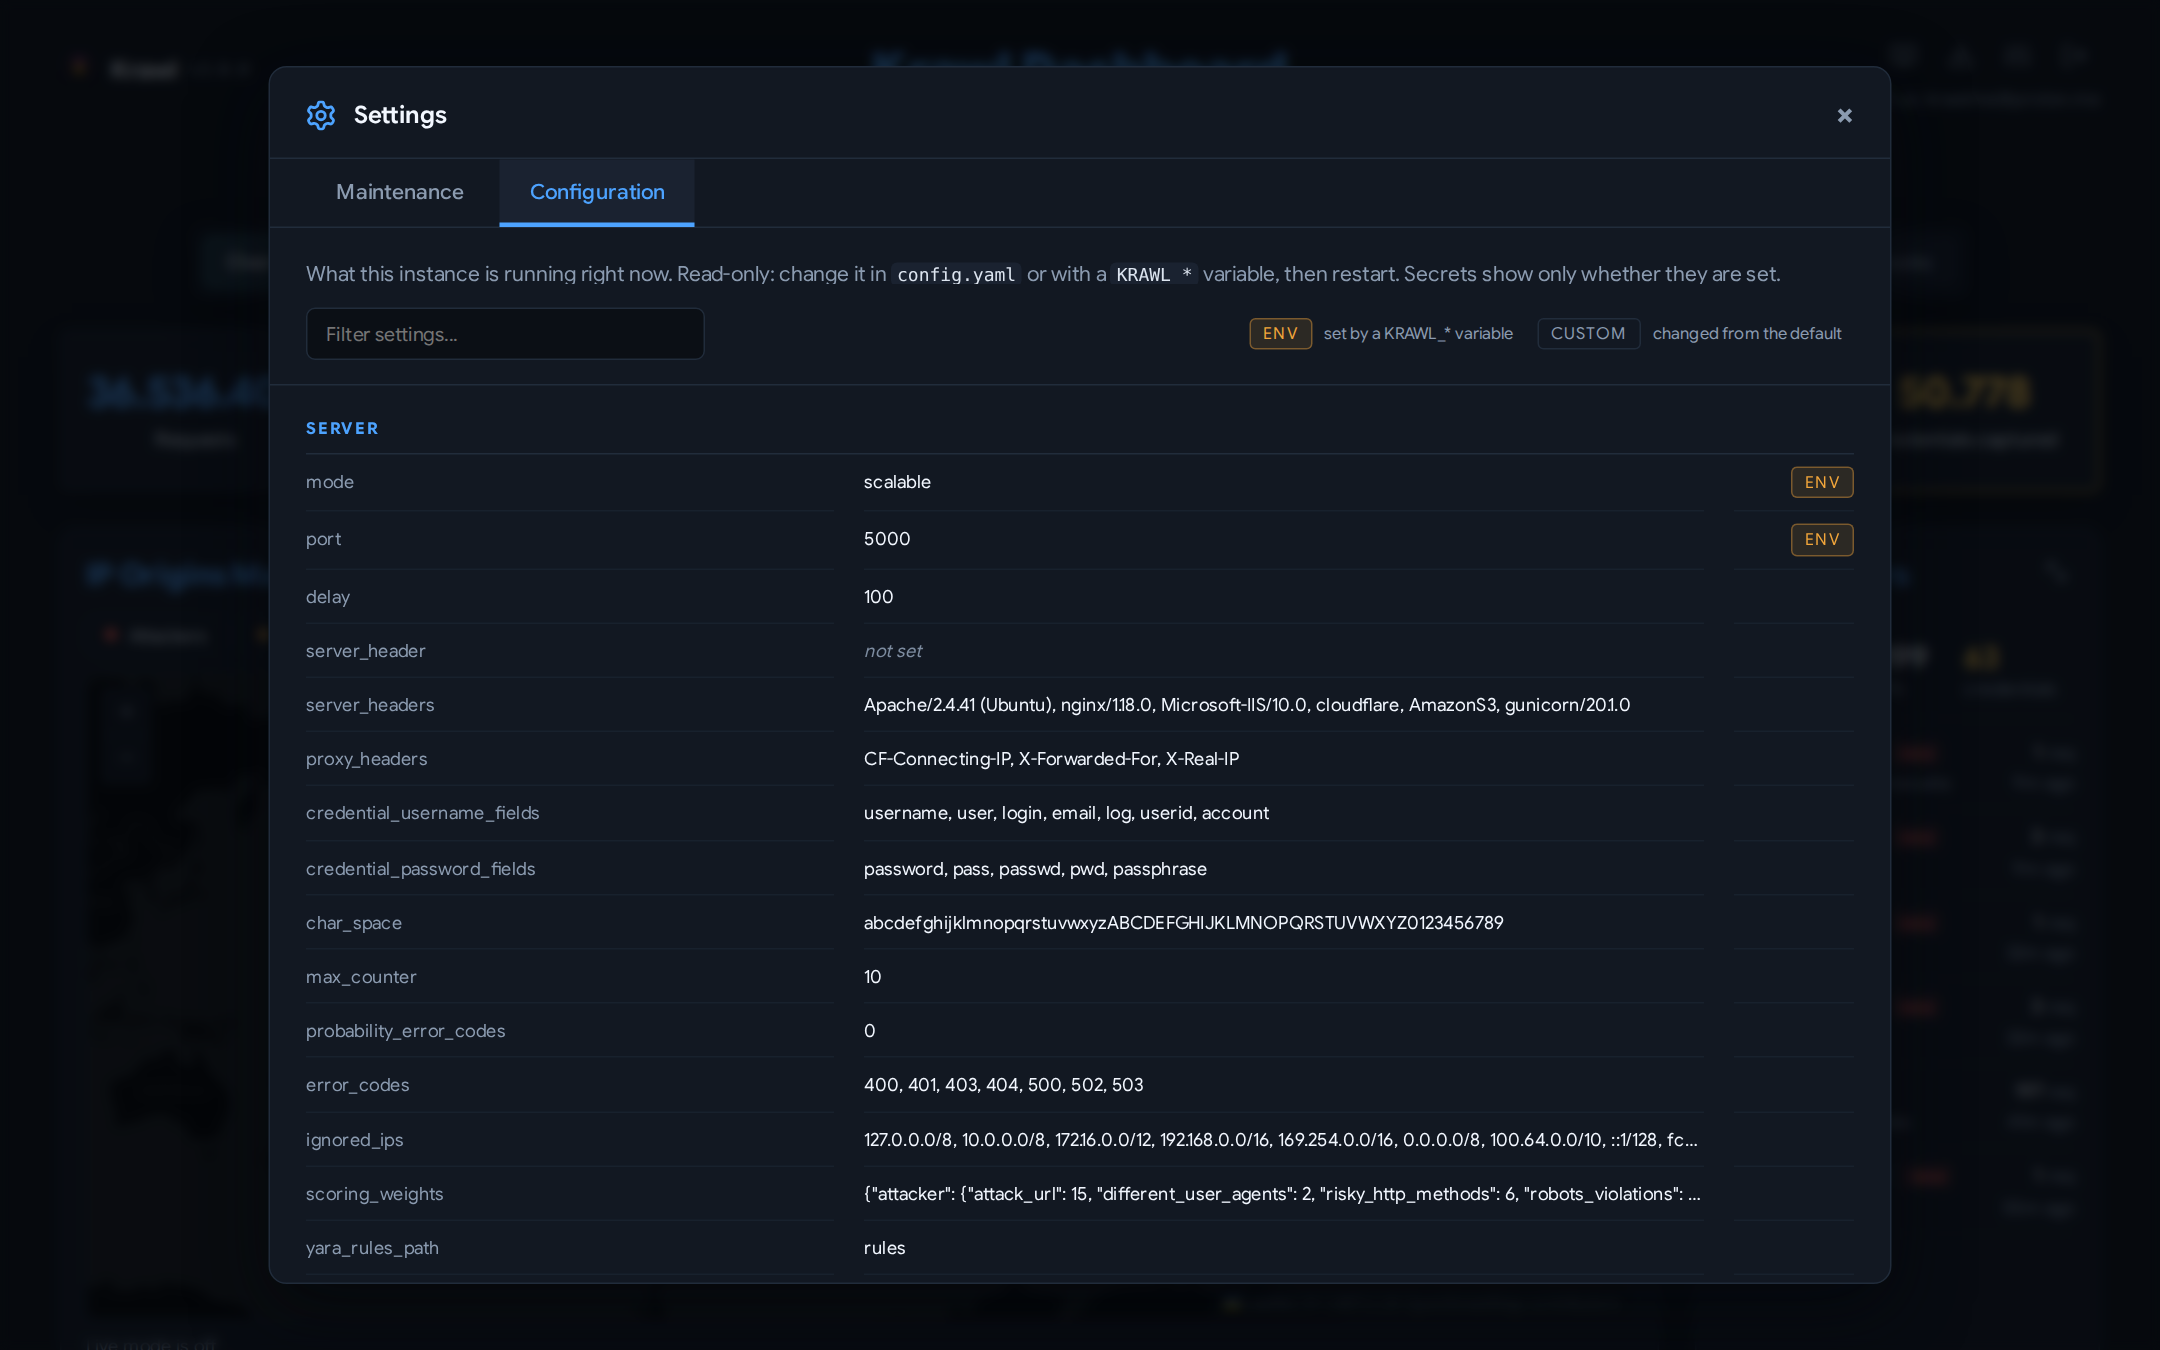
- Configuration shows the running configuration, read-only. Each setting is
badged ENV when a
KRAWL_*variable set it, or CUSTOM when it differs from the default. Secrets show only whether they are set. See Configuration.
Authentication
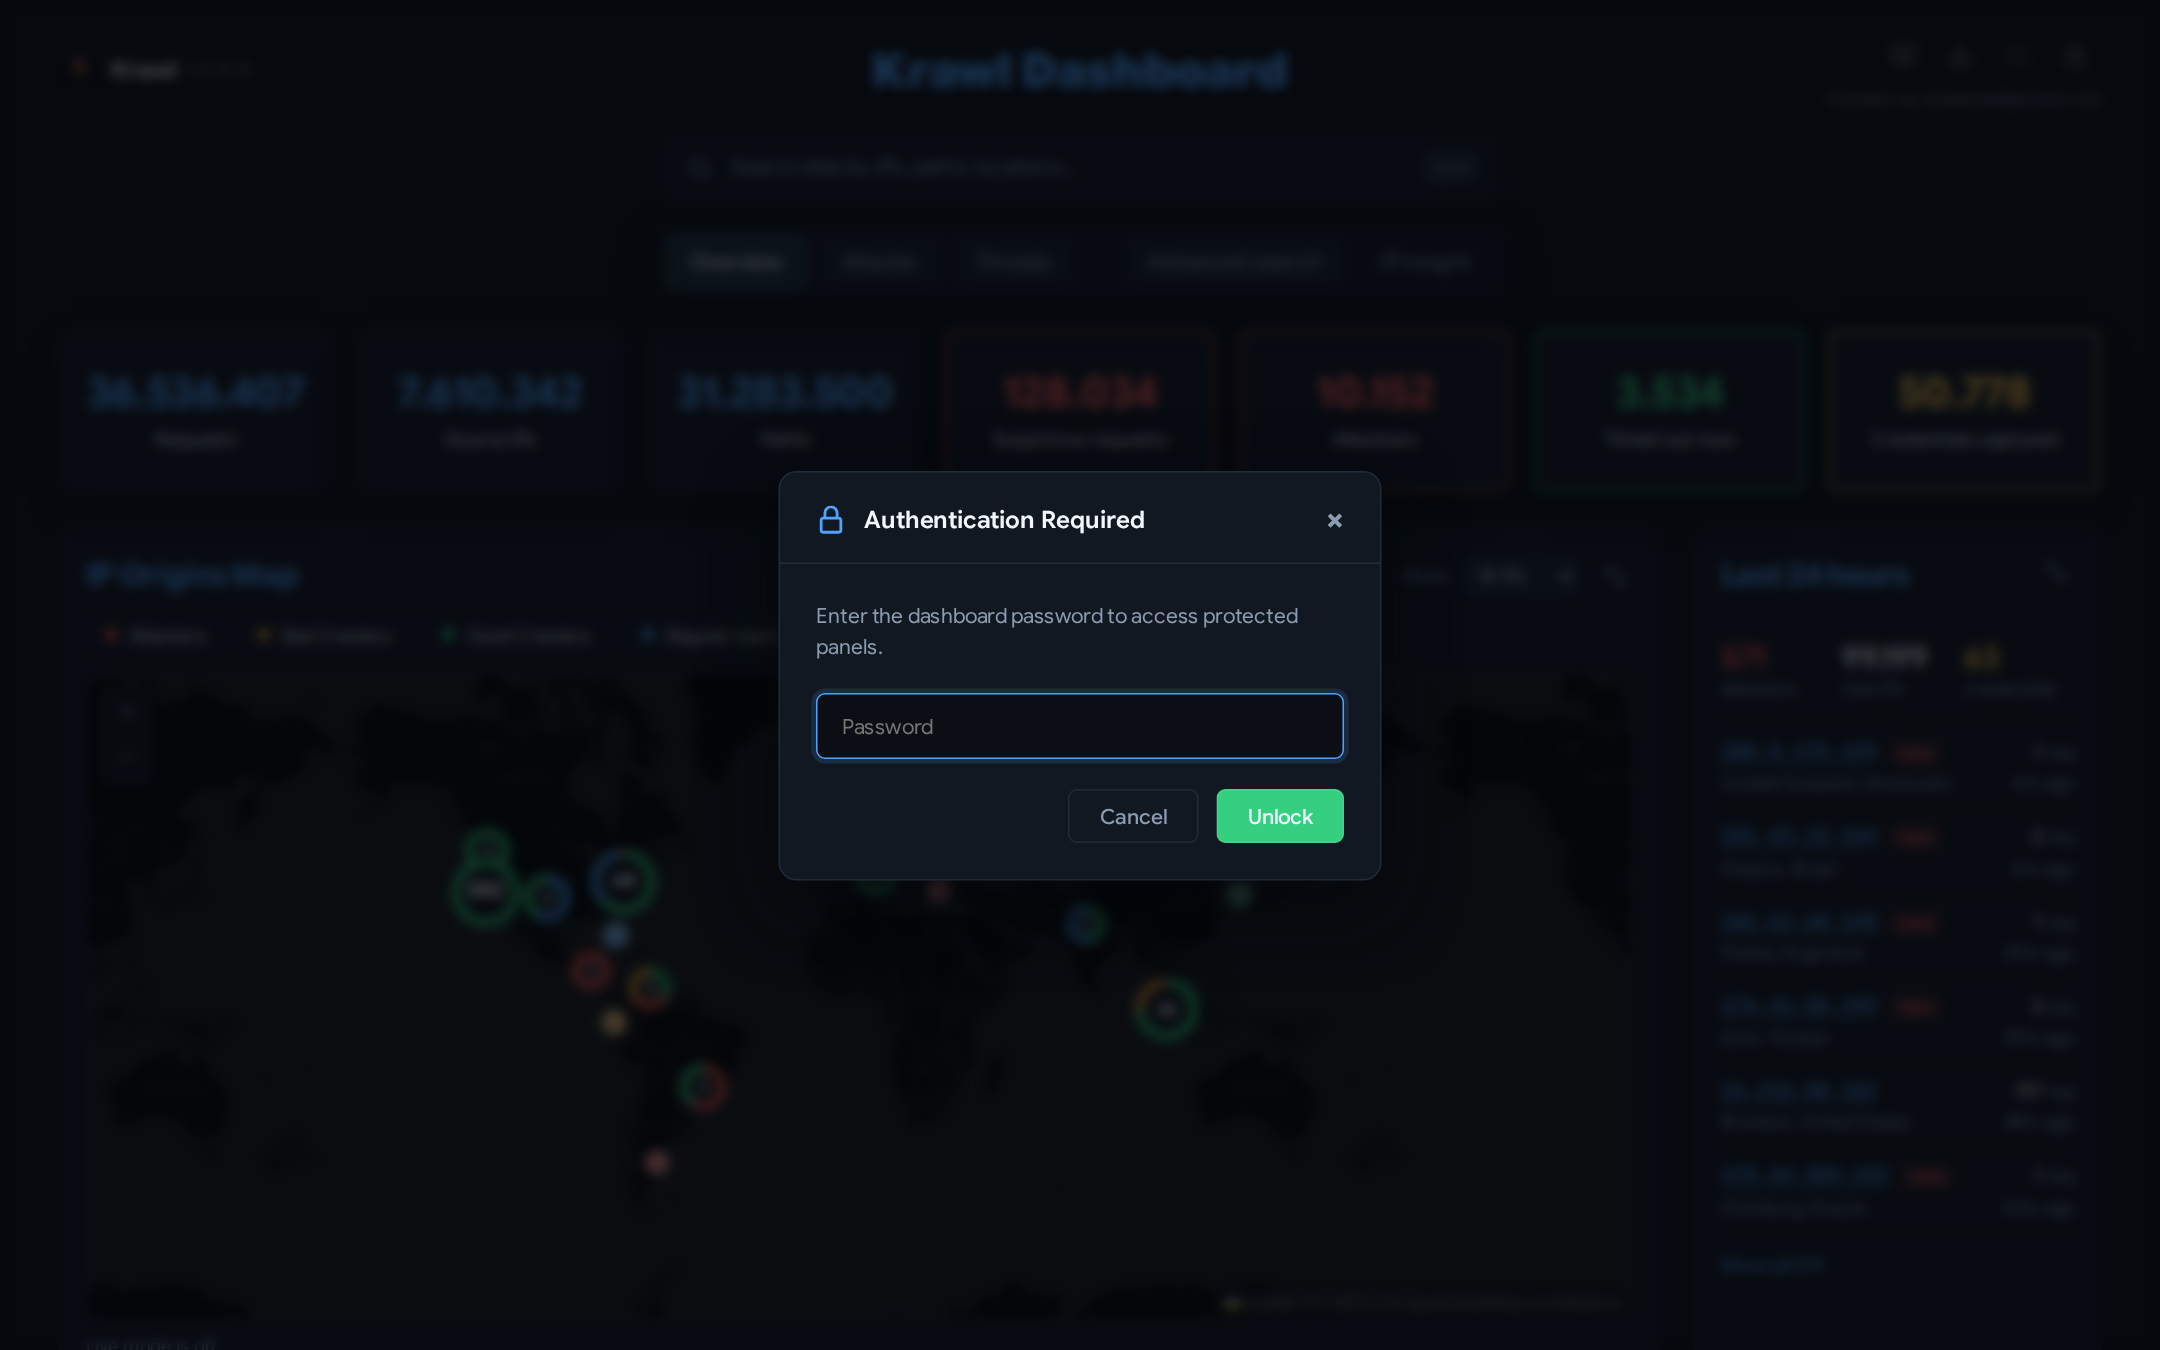
The dashboard uses session-based authentication with secure HTTP-only cookies. Protected features (Tracked IPs, Banlist, Timed out, Deception, Rules, Webhooks, Settings and the ban/track actions) require entering the dashboard password. The login includes brute-force protection with IP-based rate limiting and exponential backoff.
Sessions and the attempt counters live in Redis in scalable mode, so a cookie issued by one replica is accepted by every other one and the lockout applies per attacker rather than per pod. In standalone mode they are held in-process. Sessions expire after 12 hours, attempt counters after 1 hour.
Click the lock icon in the top-right corner of the navigation bar to authenticate or log out.
Configuration
Dashboard behaviour is controlled under the dashboard section of config.yaml (or via environment variables).
Secret path and password
dashboard:
  secret_path: null       # auto-generated at startup if null
  password: null          # auto-generated at startup if null
| Env var | Description | Default |
|---|---|---|
KRAWL_DASHBOARD_SECRET_PATH |
Custom path for the dashboard | Auto-generated |
KRAWL_DASHBOARD_PASSWORD |
Password for protected dashboard panels | Auto-generated |
Cache warmup
The dashboard pre-computes heavy queries in a background task every 5 minutes so that page loads are instant.
dashboard:
  cache_warmup: true       # enable background warmup task
  warmup_pages: 10         # pages to pre-warm per table panel
  warmup_aggregation: false  # pre-compute full top_paths/top_ua aggregations
  top_n_min_count: 5       # minimum access count to appear in top paths/user-agents panels
  domain_map_host_limit: 200 # maximum hosts drawn for the selected root (1-2000)
| Env var | Description | Default |
|---|---|---|
KRAWL_DASHBOARD_CACHE_WARMUP |
Enable background warmup task | true |
KRAWL_DASHBOARD_WARMUP_PAGES |
Pages to pre-warm per table panel | 10 |
KRAWL_DASHBOARD_WARMUP_AGGREGATION |
Pre-compute full top_paths/top_ua aggregations for zero-query serving | false |
KRAWL_DASHBOARD_TOP_N_MIN_COUNT |
Minimum access count for top paths/user-agents (set to 1 to disable filtering) |
5 |
KRAWL_DASHBOARD_DOMAIN_MAP_HOST_LIMIT |
Maximum hostnames drawn for the selected root in the domain link map (1–2000) | 200 |
Scalable mode:
warmup_aggregationis enabled by default in Helm and Kubernetes deployments. In standalone mode it is disabled because SQLite handles the load without it.
Warmup covers the Overview and Attacks panels, and the three Threats panels —
the campaign chart's opening view, the all-time cluster scan, and
warmup_pages pages of the captured-file index. Campaign clustering scans
every payload hash in its window, so on an instance with real history the
Threats tab is the slowest thing in the dashboard without it. Other chart spans
(7D, 30D) and later file pages are still computed on demand.
Branding
The top-left corner of the dashboard — mark, name, version and an optional contact — comes from config, so a deployment can carry your own team's name and a way to reach whoever runs it.
dashboard:
  branding:
    name: "Krawl"
    url: "https://github.com/BlessedRebuS/Krawl"  # null renders the name as plain text
    logo: null             # image URL shown instead of the Krawl mark
    show_version: true
    contact: null          # "soc@example.com", a URL, or plain text
name also sets the page heading (<name> Dashboard). contact is rendered
as a mailto: link if it looks like an address and as a link if it is an
http(s) URL; anything else ("Ext. 4471") stays unlinked text. url and
logo accept only http(s) or dashboard-relative paths — anything else is
dropped rather than placed in the page.
| Env var | Description | Default |
|---|---|---|
KRAWL_DASHBOARD_BRAND_NAME |
Wordmark and heading name | Krawl |
KRAWL_DASHBOARD_BRAND_URL |
Where the wordmark links | Krawl's repository |
KRAWL_DASHBOARD_BRAND_LOGO |
Image URL replacing the Krawl mark | Unset |
KRAWL_DASHBOARD_BRAND_SHOW_VERSION |
Show the version next to the name | true |
KRAWL_DASHBOARD_BRAND_CONTACT |
Contact shown under the wordmark | Unset |
Map tiles
The IP Origins Map fetches its basemap from a tile provider. The provider is
configured under the map section, so switching it never needs a code change.
map:
  tile_url: "https://services.arcgisonline.com/ArcGIS/rest/services/Canvas/World_Dark_Gray_Base/MapServer/tile/{z}/{y}/{x}"
  attribution: "© Esri, HERE, Garmin, © OpenStreetMap contributors"
  subdomains: "abcd"
  api_key: ""
  api_key_param: "api_key"
| Env var | Description | Default |
|---|---|---|
KRAWL_MAP_TILE_URL |
Tile URL template. {z}, {x} and {y} are required; {s} (subdomain) and {r} (retina suffix) are optional |
Esri dark canvas |
KRAWL_MAP_TILE_ATTRIBUTION |
Credit line shown in the map corner | Esri / OSM |
KRAWL_MAP_TILE_SUBDOMAINS |
Values substituted into {s} |
abcd |
KRAWL_MAP_API_KEY |
Appended to every tile request as a query parameter | (empty) |
KRAWL_MAP_API_KEY_PARAM |
Name of that query parameter | api_key |
Note the axis order: Esri serves tiles as {z}/{y}/{x}, while most other
providers use {z}/{x}/{y}. Copy the template exactly as the provider
documents it.
Choosing a provider
Esri dark canvas (default) needs no account and adds no watermark. It is the reason the map works out of the box.
CARTO requires an API key. Without one, every tile comes back with
API KEY REQUIRED stamped diagonally across it — the tiles still load, so
there is no error to notice, just a defaced map. Sign up at
carto.com/basemaps/apikey, then:
map:
  tile_url: "https://{s}.basemaps.cartocdn.com/dark_all/{z}/{x}/{y}{r}.png"
  attribution: "© CARTO | © OpenStreetMap contributors"
  api_key: "your-key-here"
Use the raster endpoint above, not the vector one. CARTO's documentation
leads with vector basemaps — a style.json handed to MapLibre GL. This map is
Leaflet, and tile_url is a raster {z}/{x}/{y} template; a style URL in that
field produces a blank basemap with no error in the console. The raster
basemaps.cartocdn.com endpoints are still served, and the tiles are pushed
through a desaturating filter anyway, so vector buys nothing here. The same
applies to any other provider that documents itself style-JSON-first
(MapTiler, Stadia): find their raster tile template.
Providers disagree on what to call the query parameter — CARTO and Stadia want
api_key, Thunderforest apikey, MapTiler key — so api_key_param sets it.
It defaults to api_key, which is what CARTO expects, so the block above works
as written.
OpenStreetMap needs no key but is light-themed, so it fights the dashboard until you invert it. Add this to your own CSS after setting the URL:
Also read OSM's tile usage policy before pointing a busy instance at it.
A self-hosted tile server is just another tile_url. Worth considering:
the dashboard is normally the only page you open on the instance, and every
other option tells a third-party CDN when you are looking at it.
Two things to know
The API key is public. The browser fetches tiles directly, so the key is served in the page source. That is unavoidable for a client-side map — restrict the key to your dashboard's domain at the provider rather than trying to hide it.
On Kubernetes the key still never touches the ConfigMap. Setting
config.map.api_key creates a chart-managed Secret and injects it as
KRAWL_MAP_API_KEY; to keep it out of your values file entirely, point
mapExistingSecret at a Secret you manage (External Secrets Operator, Vault,
sealed-secrets):
Attribution is a licence condition for every provider above, not decoration. It is styled to be unobtrusive; do not remove it.
Adjusting how the basemap looks
The tiles are desaturated and darkened so the category colours stand out. The treatment is a single custom property, so you can retune it without touching the rule:
Design system
The dashboard UI is a console for reading attacker traffic, and the styles are
built around that. Everything visual is defined once, as tokens, at the top of
src/templates/static/css/dashboard.css.
Tokens
| Group | Tokens | Notes |
|---|---|---|
| Surfaces | --bg --surface --raised --sunken --line --line-soft --scrim |
Deep console canvas, cards one step up |
| Text | --text --text-strong --text-dim --text-faint |
All AA or better on --bg and --surface |
| Semantics | --accent --danger --warn --ok --violet --pink --cyan |
Links and primary actions use --accent |
| Categories | --cat-attacker --cat-bad-crawler --cat-good-crawler --cat-regular-user --cat-timed-out |
Threat class, aliased onto the semantics |
| Signal | --honey |
Reserved for honeypot triggers. Nothing else is honey |
| Type | --font-ui --font-mono, --fs-2xs … --fs-2xl |
Seven steps, no ad-hoc sizes |
| Space | --s1 … --s10 |
4px base |
| Radius | --r-sm --r-md --r-lg --r-pill |
Controls / cards / modals / pills |
| Icons | --icon-sm --icon --icon-lg |
12 / 16 / 20 |
Rules
- Log data is mono. IP addresses, request paths, user agents, timestamps and
credential pairs use
--font-monoso columns align and0/Oand1/lstay distinguishable. Labels, prose and controls use--font-ui. - Honey means a trap was sprung. Attack volume is red because it is a threat; a tripped honeypot is the product working, and it owns the only warm color on the page (the two trap-count stat cards and the honeypot trigger counts).
- One icon system. Inline Octicon SVGs on a 16 viewBox, sized by
.icon,.icon-smor.icon-lg, filled withcurrentColor. No icon webfont. - Category colors come from the tokens, including in JavaScript —
map.jsandcharts.jsread them throughkrawlCategoryColors()intokens.js, so a category cannot look one way in a table and another on the map. - No
style="…"in templates. Add a class todashboard.cssinstead; the component layer at the bottom of the file exists for exactly this. The only inline styles left are Alpine's initialdisplay: noneand colors computed per-row on the server.