Metrics & Monitoring
Krawl exposes Prometheus metrics and ships with a ready-to-import Grafana dashboard so you can observe traffic, honeypot activity, and attack detections in real time.
The Metrics Endpoint
Metrics are served in Prometheus text format at:
The endpoint lives under the secret dashboard path so it isn't publicly discoverable. When metrics are disabled the endpoint returns 404 and the background refresh helpers become no-ops.
Configuration
Via config.yaml
Via Environment Variables
| Variable | Description | Default |
|---|---|---|
KRAWL_METRICS_ENABLED |
Enable or disable the Prometheus metrics endpoint | true |
Exposed Metrics
Cumulative counters
These are "total ever observed" values backed by the shared cache counter store, so every pod reports the same totals and rate() / increase() queries work as expected. They follow the Prometheus _total counter convention.
| Metric | Description |
|---|---|
krawl_accesses_total |
Total HTTP accesses recorded by Krawl |
krawl_unique_ips_total |
Number of distinct client IPs observed |
krawl_unique_paths_total |
Number of distinct request paths observed |
krawl_honeypot_triggers_total |
Total honeypot trigger events |
krawl_honeypot_ips_total |
Distinct IPs that have triggered a honeypot path at least once |
krawl_credentials_captured_total |
Total captured credential login attempts |
krawl_attack_detections_total |
Attack detections, labeled by attack_type |
krawl_write_buffer_dropped_total |
Access-log rows dropped because the write buffer was full — silent data loss, investigate any increase |
Current-state gauges
Point-in-time values. krawl_clients_total is recomputed live at scrape time; the rest are updated by background tasks (analyzer and dashboard warmup).
| Metric | Description |
|---|---|
krawl_clients_total |
Number of IPs per classification category (attacker, good_crawler, bad_crawler, regular_user) |
krawl_generated_pages_today |
AI deception pages generated today |
krawl_ips_needing_reevaluation |
IPs currently flagged for reevaluation by the analyzer |
krawl_unenriched_ips |
IPs awaiting geolocation/reputation enrichment (capped at 1000) |
krawl_auth_locked_ips |
IPs currently locked out from dashboard authentication |
krawl_timed_out_ips |
IPs currently serving an automatic rate-limit time-ban |
krawl_write_buffer_rows |
Access-log rows waiting to be flushed to the database. Rising depth means the flush task is behind — alert above 10000 |
krawl_dashboard_warmup_duration_seconds |
Last observed duration of each dashboard warmup sub-step, labeled by step |
Grafana Dashboard
A pre-built dashboard is provided at grafana-dashboard.json in the repository root.
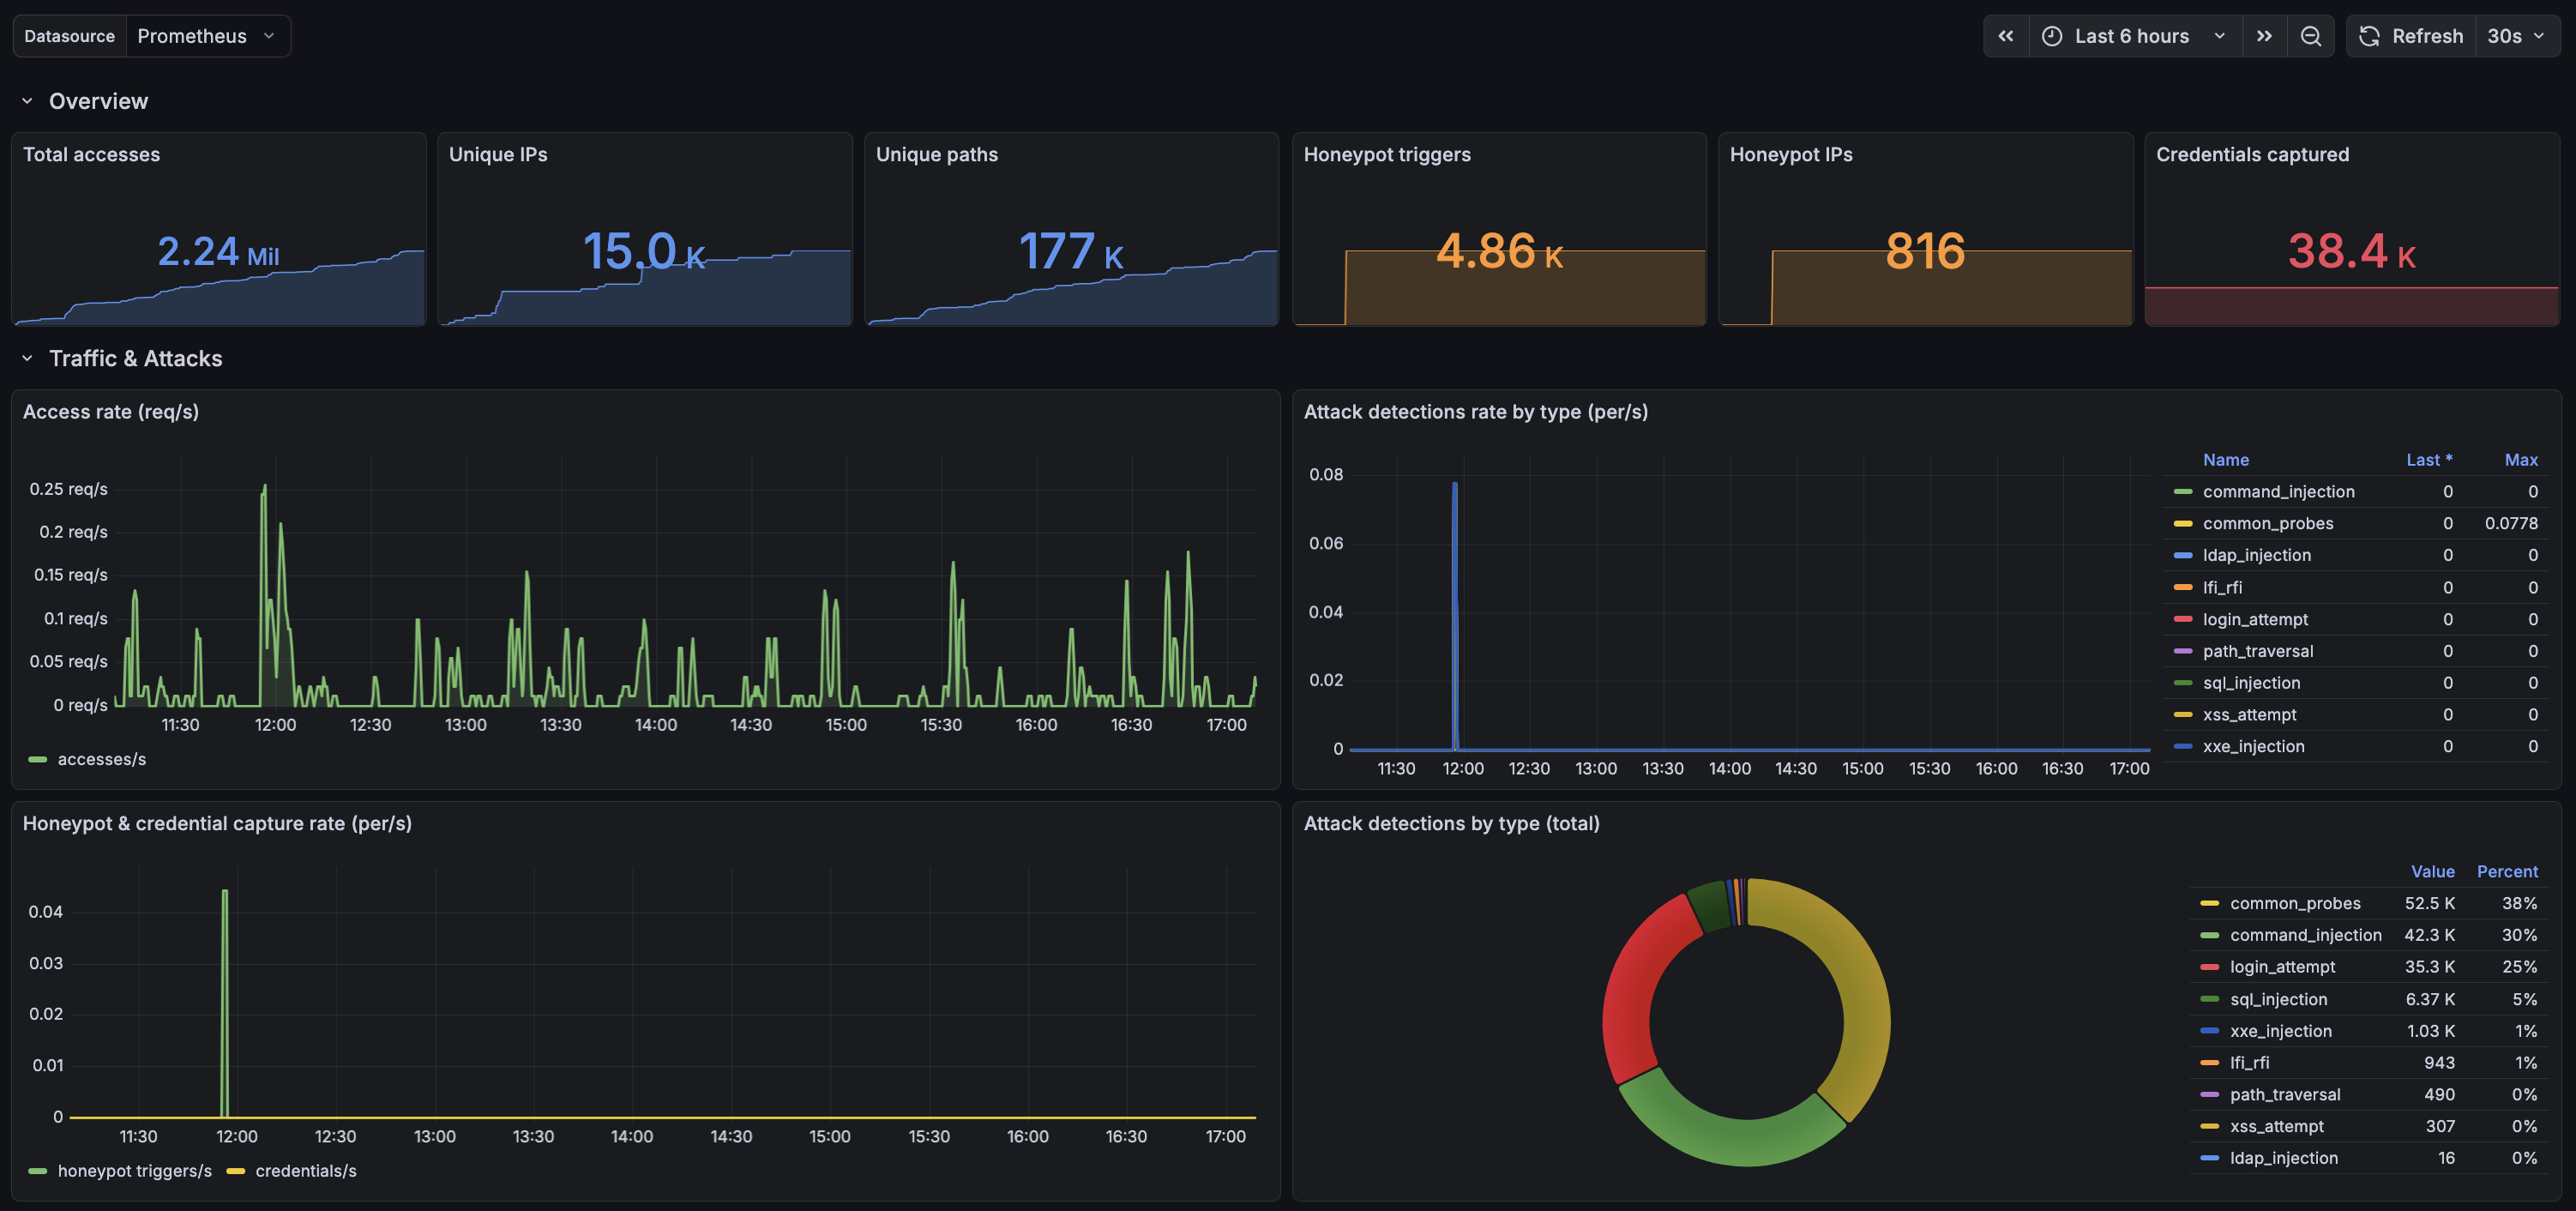
To import it:
- In Grafana, go to Dashboards → New → Import.
- Upload
grafana-dashboard.json(or paste its contents). - Select your Prometheus data source when prompted.
Panels
| Row | What it shows |
|---|---|
| Overview | Activity within the selected time range (accesses, honeypot triggers, credentials, attack detections), then lifetime totals (unique IPs and paths, honeypot IPs, AI pages today) |
| Traffic & Attacks | Access rate and attack detection rate per minute, honeypot vs credential capture rate, and attack types ranked over the selected range |
| Classification | Reputation categories stacked over time, their current split, plus timed-out and auth-locked IP counts |
| System health | Write buffer depth per pod, dashboard warmup step durations, dropped rows, enrichment and reevaluation backlogs |
Panels titled (selected range) follow the time picker. Panels titled (all time) are lifetime totals and deliberately ignore it.
Two variables sit at the top: Datasource, and Job — set the latter when one Prometheus scrapes more than one Krawl deployment, otherwise their series are merged into a single number with nothing to indicate it.
Aggregation
The dashboard collapses replicas with max(), not sum(): in scalable mode the
counters live in Redis, so every replica reports the same shared value and summing them
would multiply by the pod count.
The write buffer metrics are the exception — that buffer is process-local, so
krawl_write_buffer_rows is graphed per pod (one line each, so a single replica
falling behind stays visible) and krawl_write_buffer_dropped_total is summed across
them.
Deploying it in Kubernetes
The chart can ship the dashboard as a ConfigMap for the Grafana sidecar to discover:
grafanaDashboard:
  enabled: true
  label: grafana_dashboard      # what your sidecar watches
  labelValue: "1"
  namespace: ""                 # e.g. cattle-monitoring-system; empty = release namespace
Editing the dashboard
Both grafana-dashboard.json and the copy the chart embeds at
helm/files/grafana-dashboard.json are generated from scripts/build_grafana_dashboard.py.
Edit the script and re-run it rather than editing the JSON:
If you tuned a dashboard inside Grafana instead, export it (Share → Export → Save to
file), port the changes into the script, and re-run it — then both stay in step.
Set "id": null on anything you paste in; Grafana exports carry a local database id
that is meaningless elsewhere.
Scraping with Prometheus
Standalone / Docker
Point your Prometheus scrape config at the metrics path. Because the path includes the secret dashboard path, set a fixed dashboard.secret_path in your config so the URL is stable:
scrape_configs:
  - job_name: krawl
    metrics_path: /<dashboard_secret_path>/metrics
    static_configs:
      - targets: ["krawl-host:5000"]
Kubernetes (Prometheus Operator)
The Helm chart can render a ServiceMonitor for the Prometheus Operator. Enable it in your values:
serviceMonitor:
  enabled: true
  interval: 30s
  scrapeTimeout: 10s
  # Extra labels so your Prometheus's serviceMonitorSelector matches this
  # resource (e.g. release: kube-prometheus-stack).
  labels: {}
  honorLabels: false
  relabelings: []
  metricRelabelings: []

config:
  metrics:
    enabled: true
  dashboard:
    secret_path: "your-fixed-secret-path"
The ServiceMonitor is only rendered when all of the following are true:
serviceMonitor.enabledistrueconfig.metrics.enabledistrueconfig.dashboard.secret_pathis set — the metrics path is/<secret_path>/metrics, so an auto-generated/blank path can't be scraped
The CRD monitoring.coreos.com/v1 must be present in the cluster (installed by kube-prometheus-stack or the Prometheus Operator).
Verifying
Curl the endpoint directly (replace the secret path):
You should see Prometheus-formatted output beginning with # HELP krawl_accesses_total ....